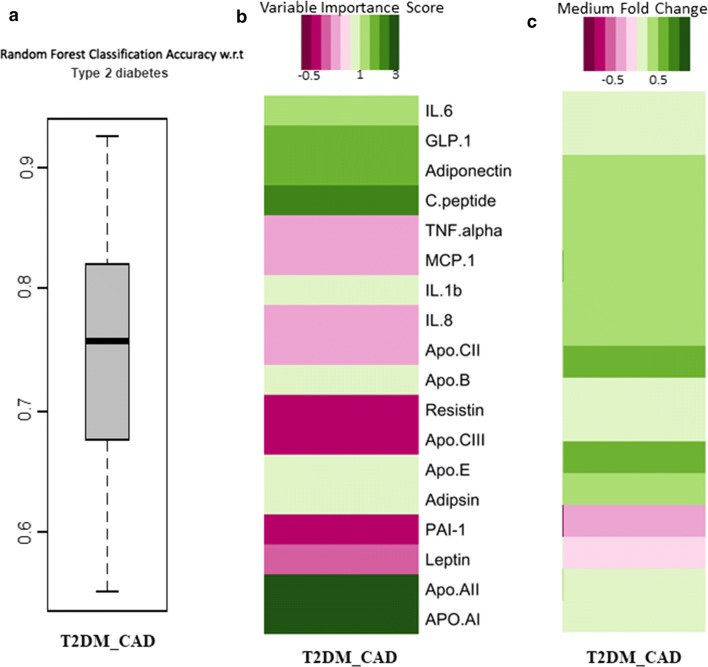
Fig. 6.
a Classification area under the curves (AUCs) of random forest-based classifiers (trained on the marker profiles) for predicting the T2DM_CAD with respect to T2DM. For each disease state, classification accuracies were obtained after 100 iterations, where in each iteration, the model was trained on 50% of the data and validated/tested on the rest 50%. b Variable importance scores of the markers identified to be optimal for at least one of the three comparisons (T2DM v/s T2DM_CAD). c Fold change of the median abundances of the corresponding markers for each comparison (T2DM v/s T2DM_CAD)

