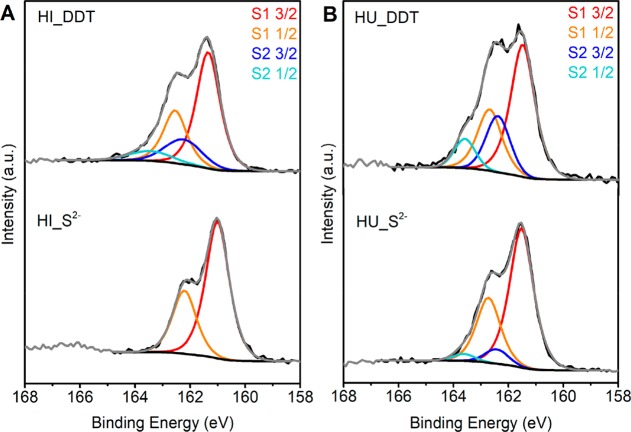
Figure 7.
XPS of the sulfur 2p region of Cu2–xS nanocrystals before and after ligand exchange with S2– prepared by (A) hot-injection and (B) heating-up synthesis protocols. The black lines indicate the experimental data. The fits of the first sulfur component are shown in red and orange, and the fit of the second sulfur component is shown in blue and light blue.

