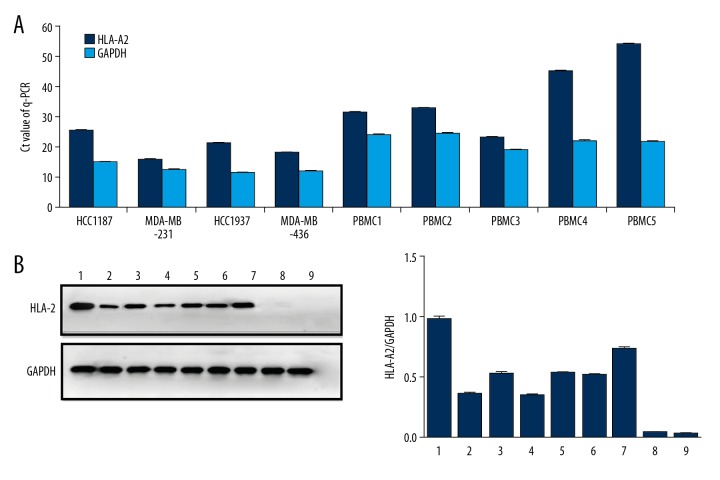
Figure 1.
HLA-A2 detection of PBMCs. (A) Reverse-transcription q-PCR was used to detect HLA-A2 expression on TNBC cell lines and PBMCs from different donors. Each histogram represents the mean Ct value of the PCR products. HLA-A2 genes exhibited high mRNA expression in the cells compared with GAPDH, except for PBMC 4 and PBMC 5. (B) Western blot analysis was performed to detect the protein expression levels of HLA-A2 or GAPDH in different cells with specific antibodies. Based on band intensity, HLA-A2 had high expression in all the cells, except for PBMC 4 and PBMC 5. 1: MDA-MB-231, 2: HCC937, 3: MDA-MB-436, 4: HCC1187, 5–9: PBMC 1–5.

