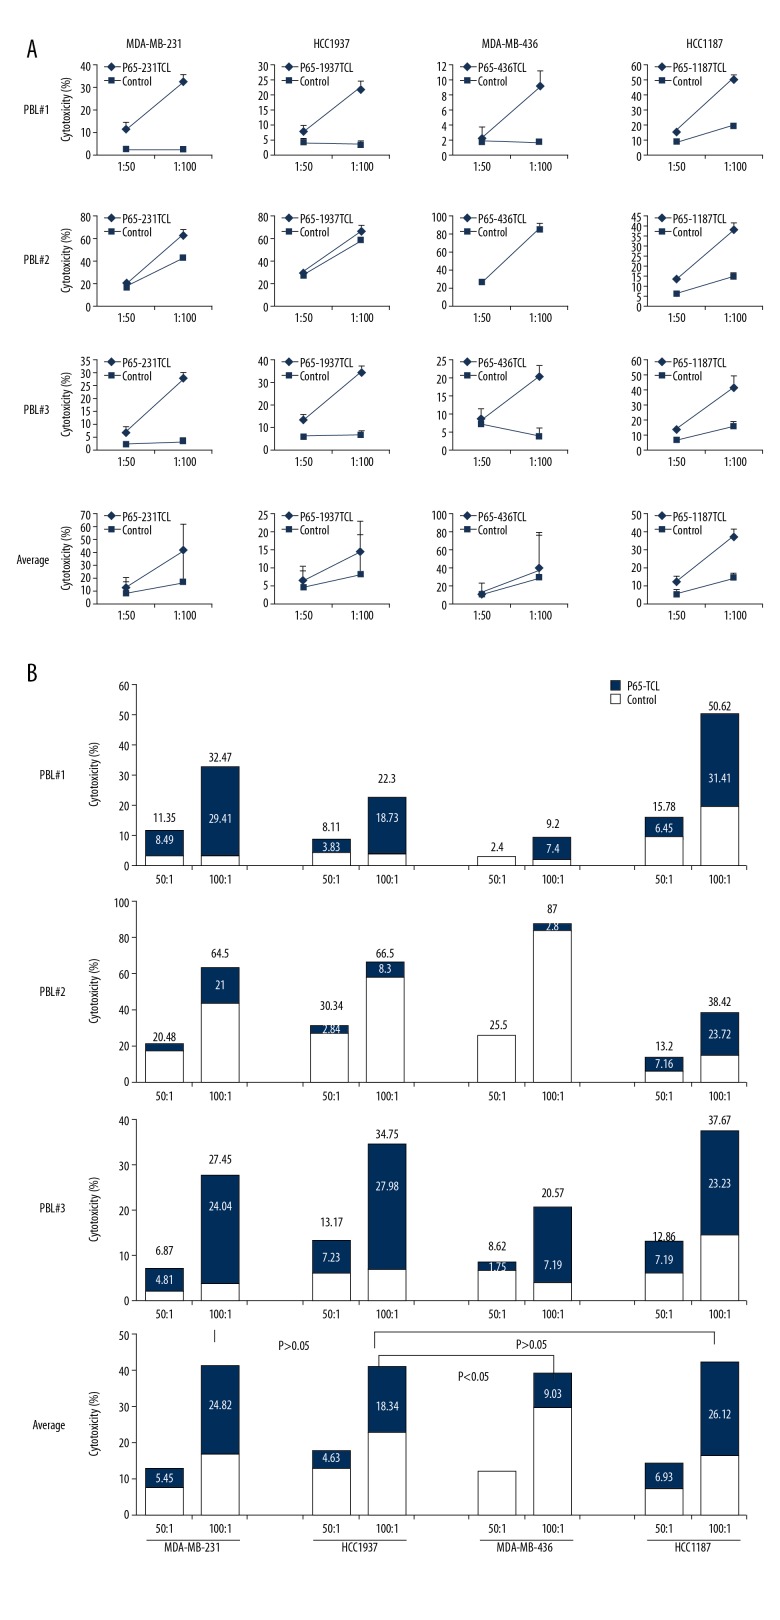
Figure 5.
Cytotoxicity of CTL to TNBC cells. Specific CTL killing assay: The splenocytes were stimulated with TCL for 48 h and CTL (CD8, IFN-γ double-positive PBL) prepared as in Figure 4 were used as effector cells. Corresponding TNBC cells were used as target cells. (A) Killing curve of PBMC to TNBC cells; (B) Killing percentage in each assay. Numbers above column represent killing percentage of PBL stimulated with TCL-loaded DC. Numbers in column represent specific killing percentage of CTL in PBL stimulated with TCL-loaded DC (calculated as killing percentage of TCL group minus killing percentage of Control group).

