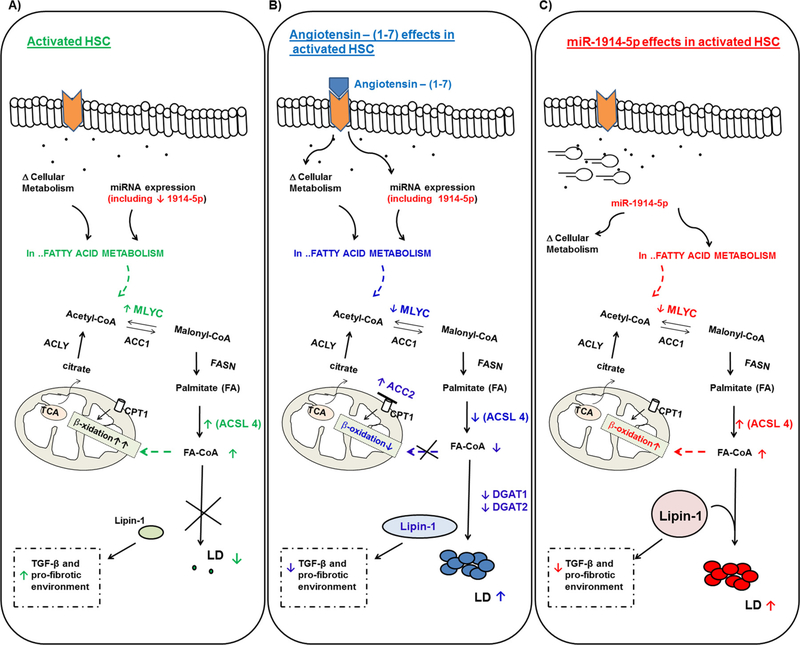
Fig. 10.
Schematic representation summarizing the effects of the ang-(1–7) and the miRNA-1914-5p in activated LX-2 lipid metabolism and their connections on the control of profibrotic environment. Central elements of the lipid metabolism pathway are represented. Target molecules, whose molecular effects support the major differences between the groups are presented in color letters: green; blue and red for (A) activated LX-2; (B) angiotensin-(1–7) treated cells; (C) miRNA-1914-5p transfected-cell. Symbols represent the connections as follow: (↑) increased amount; (↓) decreased amount; (X) pathway inhibition; ( ) structure blockage. (For interpretation of the references to colour in this figure legend, the reader is referred to the web version of this article.)

