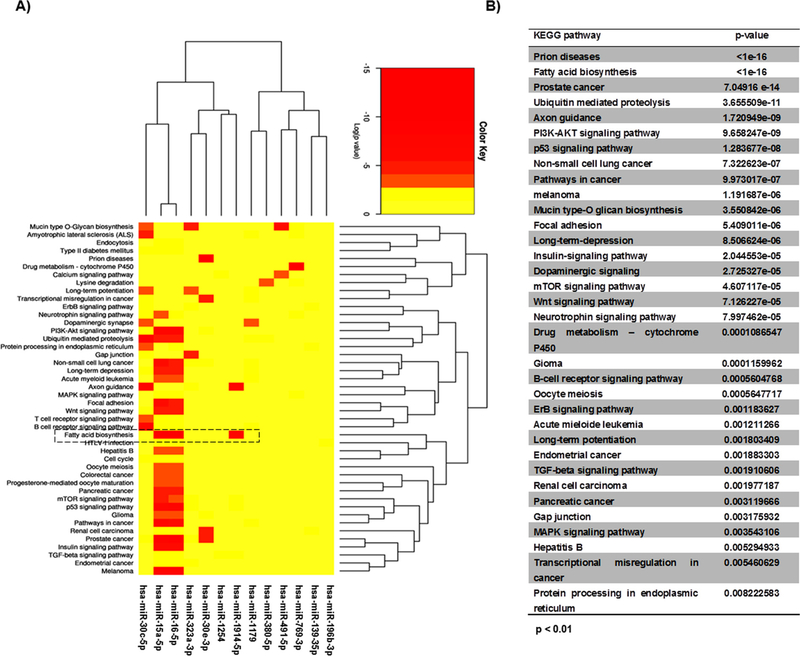
Fig. 3.
KEGG cellular signaling of LX-2 cultivated under different conditions. (A) Heatmap of the 13 miRNAs differentially expressed in LX-2 groups and KEGG cellular signaling using DIANA-microT-CDS algorithm (p < 0.01). Colors of the heatmap represent the Z-score: higher – red, lower – yellow. (B) KEGG cellular signaling of the 13 miRNAs. (For interpretation of the references to colour in this figure legend, the reader is referred to the web version of this article.)

