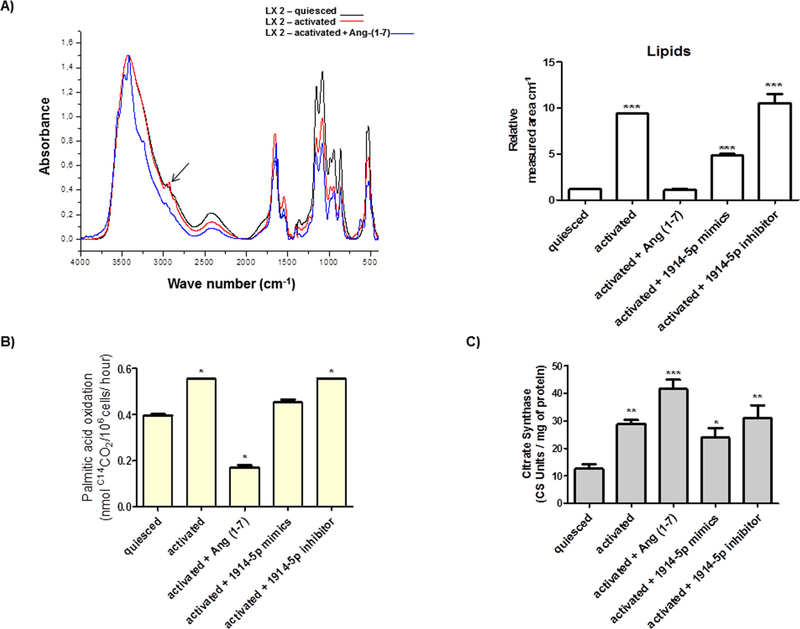
Fig. 5.
Cellular fatty acid metabolism in LX-2 groups. (A) UART-FITR spectra from regions 4000–450 cm−1 from LX-2 groups containing major assigned bands for lipids (regions 3000–2850 cm−1 – arrow), which were relative quantified. (B) Fatty acid oxidation in LX-2 cells. (C) Citrate synthase measurement. Graphs represent the mean values of at least three independent experiments. ANOVA testing showed significant differences (p < 0.05).

