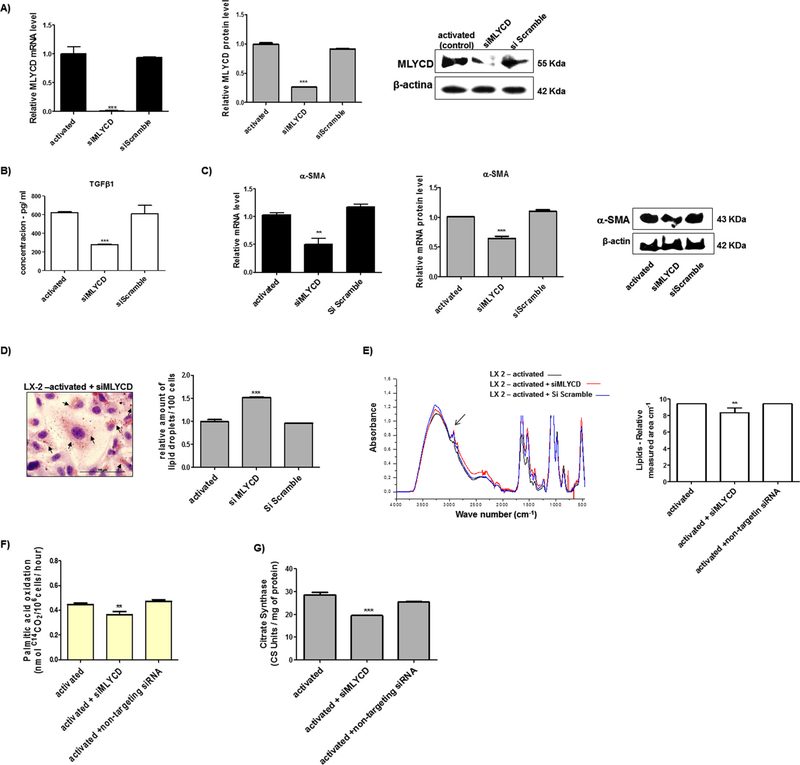
Fig. 7.
Functional analyses of the effect of MLYCD gene silencing in groups of LX-2. (A) MLYCD mRNA and protein levels (B) TGF-β1 production measured by ELISA. (C) mRNA and protein levels of the fibrotic marker α-SMA. (D) Lipid droplets amount in LX-2 cultures. (E) UART-FITR spectra of LX-2 groups from regions 4000–450 cm−1 containing major assigned bands for lipids (regions 3000–2850 cm−1 – arrow), which were relative quantified. (F) Fatty acid oxidation in LX-2 groups. (G) Citrate synthase measurements. Graphs were plotted using values of the average from three independent experiments, and the error bars represent the standard deviation of the mean. ANOVA testing was applied. The significance level was set at p < 0.05.

