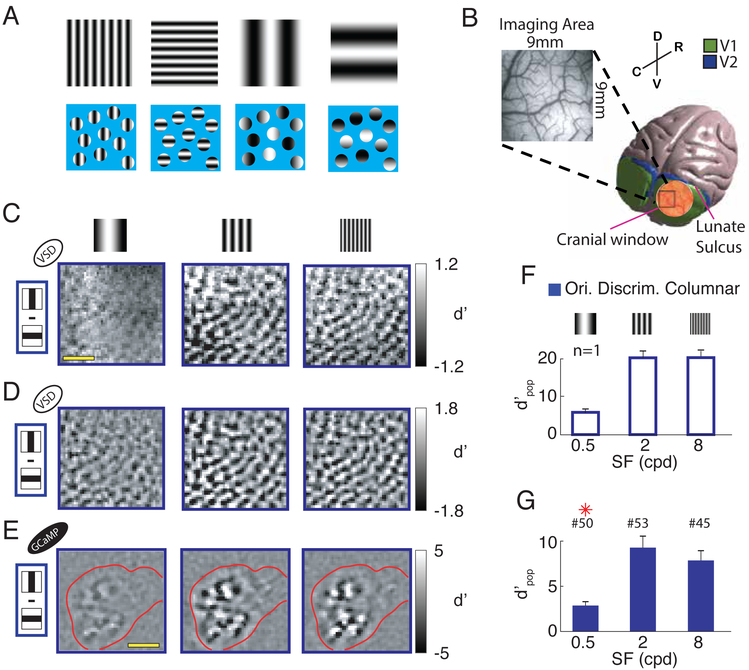
Figure 1. Discriminability of columnar-scale orientation tuned responses to orthogonal gratings as a function of spatial-frequency.
(A) Schematic demonstration of the “aperture problem” for low SF stimuli. The four gratings on the top row (two orientations for medium and low SFs, respectively) are re-displayed in the bottom row behind a blue mask, with small circular apertures, each one representing the RF of a V1 neuron. At low SFs, the oriented contrast pattern in each individual aperture carries limited information about orientation. However, orientation information can be obtained by combining information about the relative positions of apertures with bright and dark patterns. (B) 3D model of the macaque brain with a superimposed image of the cranial window (in scale). The insert shows a picture of the vasculature in an imaging area. Spatial reference abbreviations: R=rostral, C=caudal, D=dorsal, V=ventral. (C) Pixel-by-pixel discriminability (d’ map) across responses to two orthogonal gratings, for three stimulus SFs (0.5, 2 and 8cpd), from an example session. Amplitude expressed in signed d′. (D) Similar to C but isolating the columnar response component with bandpass filtration at 0.8-3 cycles per mm. (E)Similar to D but in a different monkey, using calcium imaging. Red contour represents cortical area in which the calcium indicator GCaMP6f is expressed. Scale bar in C and E - 2mm. (F) Overall discriminability (d′pop; see Methods) of columnar responses to gratings stimuli with orthogonal orientations, at the three SFs, in the same example session as in C and D. Error-bars indicate bootstrapped standard errors. (G) Similar to F but summary across sessions. Error-bars indicate standard-error of the mean across sessions. Red asterisks signal significant difference with respect to the central SF condition (two-sample t-test P<0.05). The number of sessions per SF is indicated above the corresponding bar. All figures and text refer to VSD imaging unless explicitly noted otherwise. Ori. Discrim – orientation discrimination. Here and in subsequent figures, open bars indicate results from an example session while solid bars indicate summary across sessions.

