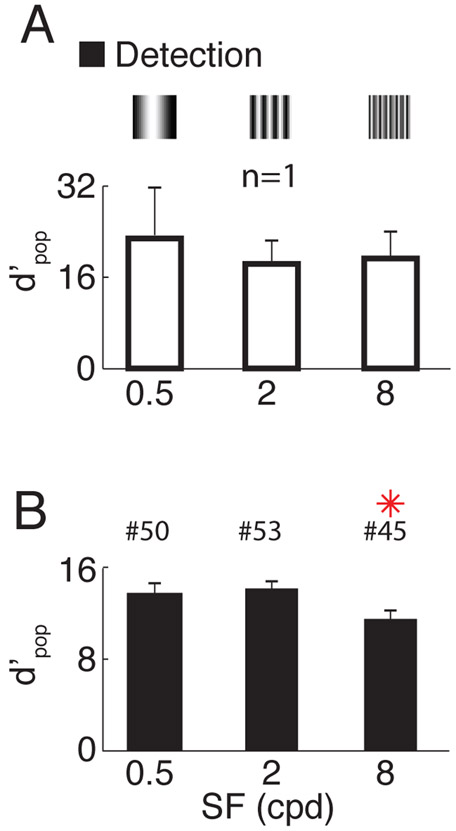
Figure 2. Detectability of responses to grating stimuli as a function of stimulus spatial frequency.
(A) Overall discriminability between responses to gratings vs. blank, at the three different stimulus SFs, in the same example session as in Figure 1. Error-bars indicate bootstrapped standard errors. (B) Similar to A but summary across sessions. Error-bars indicate standard-error of the mean across sessions. Red asterisks signal significant difference with respect to the central SF condition (two-sample t-test, P<0.05). The number of sessions per SF is indicated above the corresponding bar.

