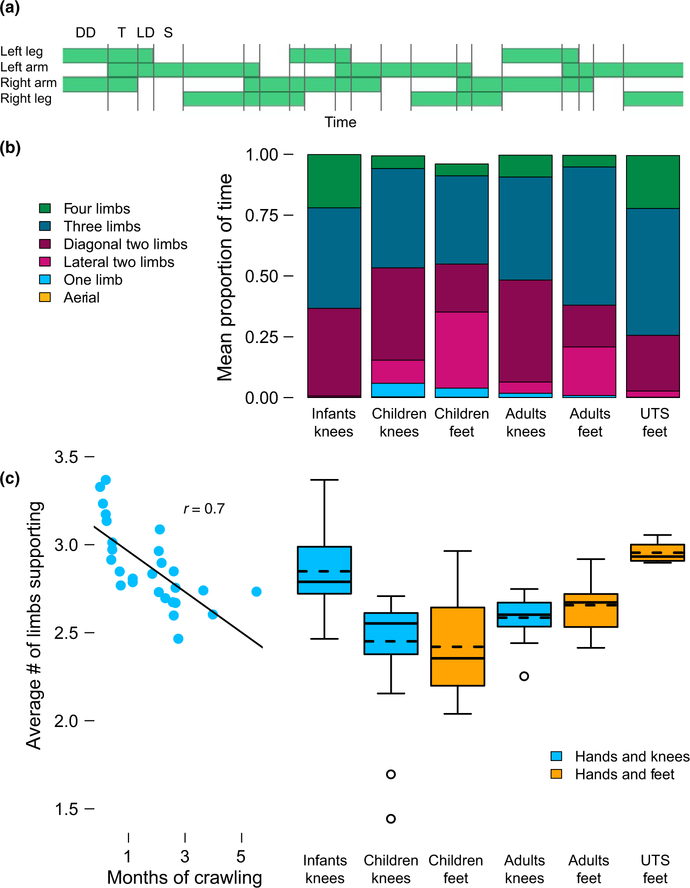
FIGURE 5.
Support and flight. (a) Timeline depicting a single crawling sequence (from a child) containing periods of support on one, two, and three limbs (denoted by gray vertical lines). Note, zero‐ and four‐limb support are not depicted. DD = diagonal double limb support, T = triple limb support, LD = lateral double limb support, S = single limb support. (b) Average proportion of time spent in each combination of limbs for each group crawling on hands and knees or hands and feet. Aerial periods were so brief they are not visible in the graph. Average number of limbs supporting the body. Left side: scatter plot showing average number of limbs used for support across months of crawling experience in the infants. Each symbol depicts data from one session. Right side: box plots showing average number of limbs used for support for each group crawling on hands and knees or hands and feet. Solid lines denote medians, dashed lines denote means, and circles denote outliers beyond 1.5 times the interquartile range

