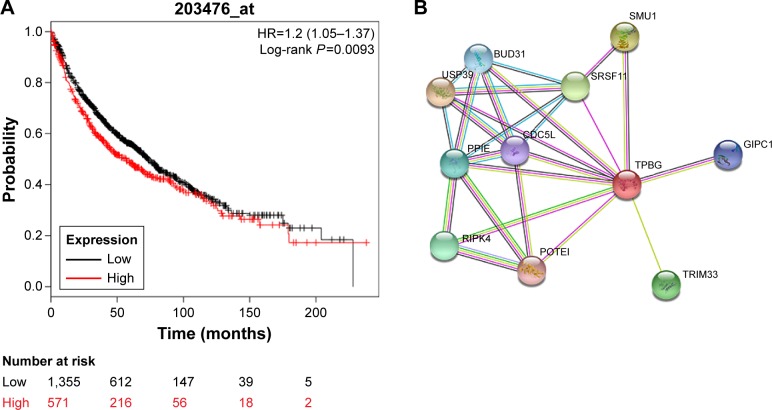
Figure 5.
Survival prognostic curve and related protein interaction network of TPBG in the KM Plotter.
Notes: (A) The relationship between the expression level of TPBG A in the KM Plotter and the OS period of lung cancer patients. (B) Protein–protein interactions: circles represent the protein; straight lines represent the interaction between proteins, and thicker lines mean the stronger interaction between the two.
Abbreviations: KM, Kaplan-Meier; TPBG, trophoblast glycoprotein.

