
Fig. 4.
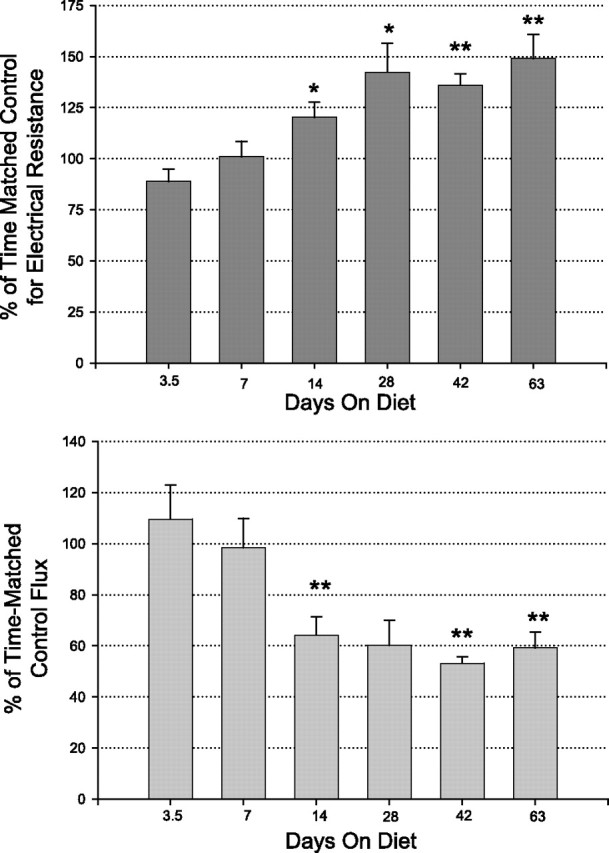
Time course of methionine-restriction-induced changes in colon epithelial barrier function. Top: relative change of transepithelial electrical resistance compared with time-matched controls. Bars indicate means ± SE (n = 6 to 12 separate time-matched tissues). Bottom: transepithelial mannitol flux on the same tissues. *P < 0.05; **P < 0.001 (Student's t-test) for comparison of tissues from MR diet vs. AA diet animals.