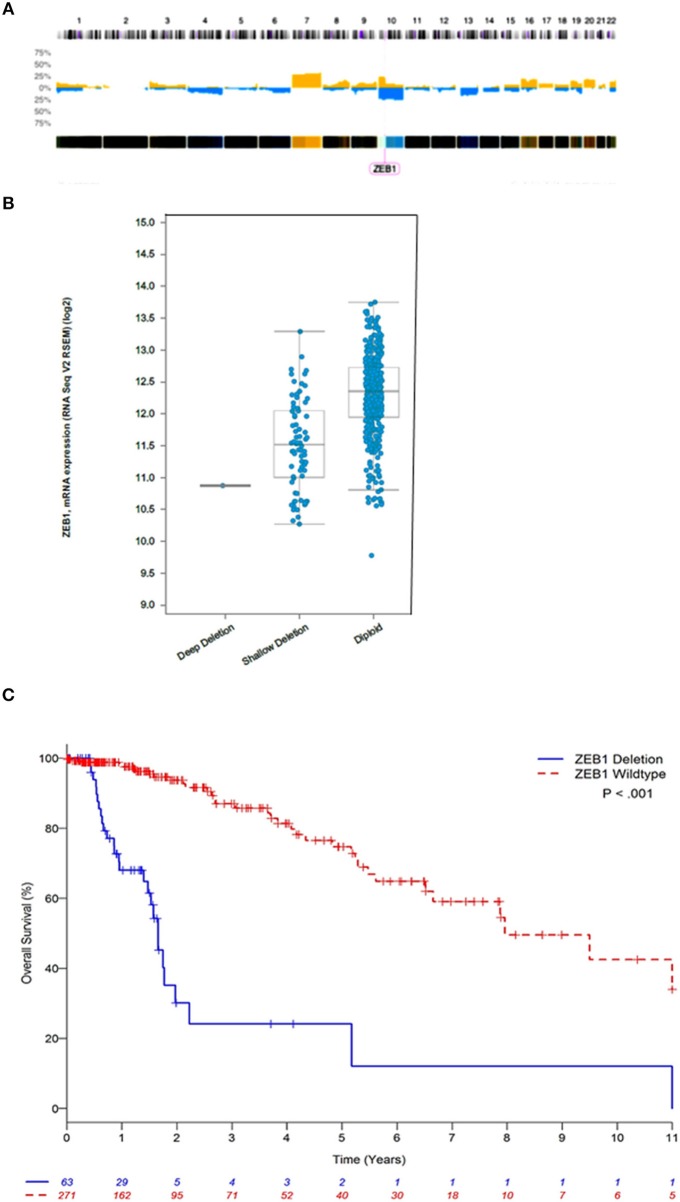
Figure 1.
ZEB1 copy number aberrations in low grade gliomas. (A) Histogram of copy-number of low grade glioma patients. This plot represents an aggregate of low grade gliomas. Percentage values in Y axis corresponding to numbers of gains (yellow) and losses (blue) account for the whole dataset. (B) ZEB1 deletion represented by deep deletion (homozygous), shallow deletion (heterozygous), diploid (wildtype), corresponding to the ZEB1 expression level represented on the Y axis. (C) Estimated Kaplan-Meier survival curves based on copy number for ZEB1 low grade gliomas patients **P < 0.001. ZEB1 deletion for low grade glioma, defined as copy number less than or equal to −0.5 (n = 63); wildtype (WT) defined as copy number greater than or equal to zero (n = 271). Two-tailed student t-test identified a significant difference between these two groups **P < 0.001.

