Figure 2.
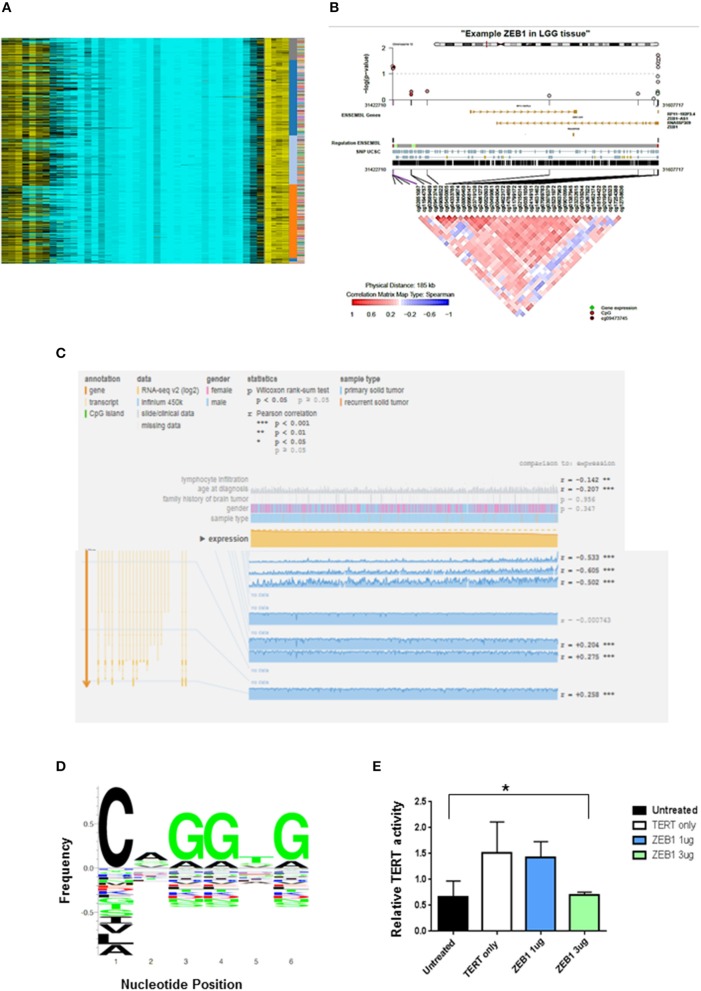
ZEB1 DNA Methylation in low grade gliomas. (A) Heat-map representation of an unsupervised clustering of DNA methylation profiles of 434 low grade glioma tumors. Each row represents a probe; each column represents a sample. The level of DNA methylation (beta value) is represented with a color scale methylated (yellow) and unmethylated (blue). Sample, subgroup association, and patient ID are indicated at the right. (B) Representative coMET plot of ZEB1 methylation in a low grade glioma patient to identify methylated CpG probe clusters. The coMET plot generates localized plots of estimated DNA methylation correlation between CpG sites (co-methylation). (C) Mexpress plot was used to further specify DNA methylation. A negative correlation can be identified between increased ZEB1 DNA methylation and ZEB1 expression in low grade glioma patients. (D) ZEB1 DNA binding domain sequence identified by TERT promoter analysis and motif enrichment. The letter height indicates the occurrence frequency which is denoted by the Y-axis. And the corresponding nucleotide at each position denoted by the X-axis. (E) A luciferase TERT promoter reporter was transiently transfected into 293T cells with or without transient transfection of certain ZEB1 expressing construct concentrations. The relative luciferase level indicates TERT promoter activity and is expressed on the Y-axis. TERT activity was substantially decreased with transient transfection of ZEB1. Experiments were quantified by one-way ANOVA, *P < 0.05.

