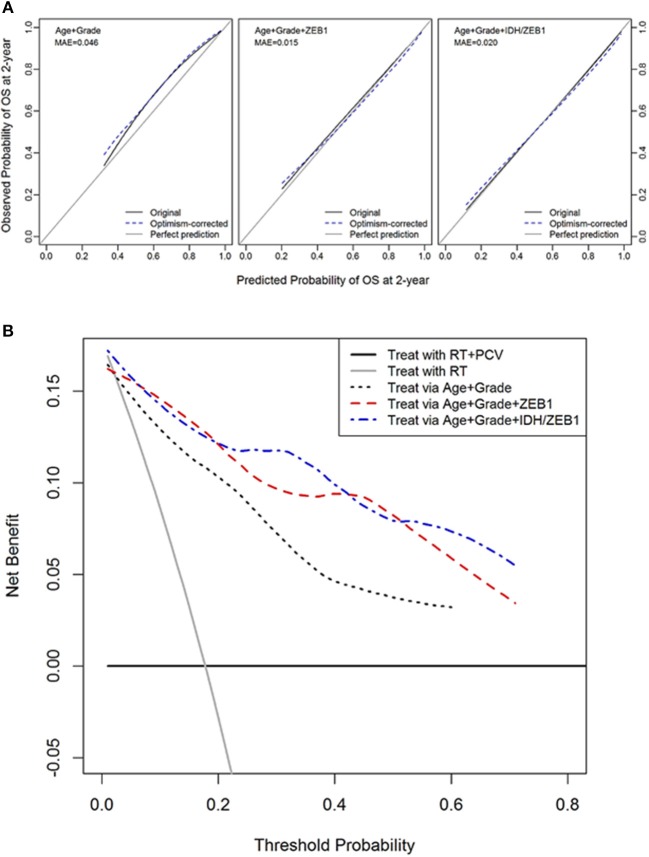
Figure 3.
Decision curve analysis of ZEB1 and ZEB1/IDH1. (A) Calibration plots for 2-year overall survival with models with and without ZEB1 or IDH/ZEB1 in patients with grade II/III gliomas. The 45° line is a reference line indicating a perfect prediction; the black curve indicates the performance of the model; and the blue dotted curve indicates optimism-corrected estimates by bootstrapping with 1,000 replicates. (B) Decision curve analysis for 2-year mortality with the models with and without ZEB1 or IDH/ZEB1 in patients with grade II/III gliomas. Decision curve for the model without ZEB1/IDH1, with ZEB1, and with ZEB1/IDH1 to predict treatment within 2 years of diagnosis with age and/or grade. The small gray line indicates the net benefit for “treat all,” while the horizontal line indicates “treat none.” These 2 lines serve as a reference for the lines for the net benefit of models with or without the molecular markers ZEB1/IDH1. We see that the predictions get better with use of the molecular markers ZEB1 alone or with ZEB1 and IDH1 together with the conventional determinants of age and grade. RT, radiation therapy; PCV, procarbazine, CCNU, and vincristine.

