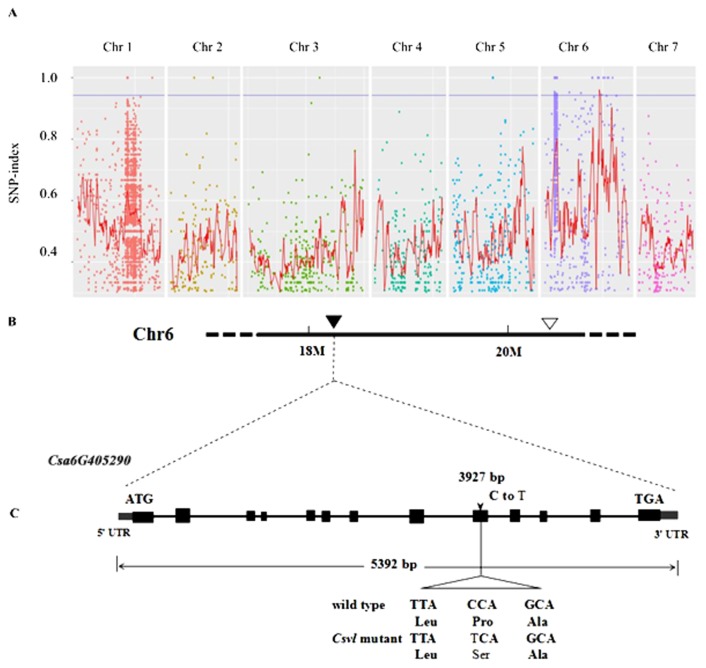
Fig. 3.
Scatter plot of SNP-index for Csvl mutant and the structure diagram of Cscs gene. A: Distribution of SNP-index on seven chromosomes of cucumber in mutant pool. The red line indicates the distribution of average SNP-index; the blue line represents the threshold. B: Two SNPs located on cucumber chromosome 6. Black triangles indicate non-synonymous SNP-18277305; white triangles indicate SNP-23376757 located in the splicing site. C: The structure of predicted Csa6G405290. Rectangles represent exons; solid lines represent introns; arrow indicates the position of SNP 18277305.

