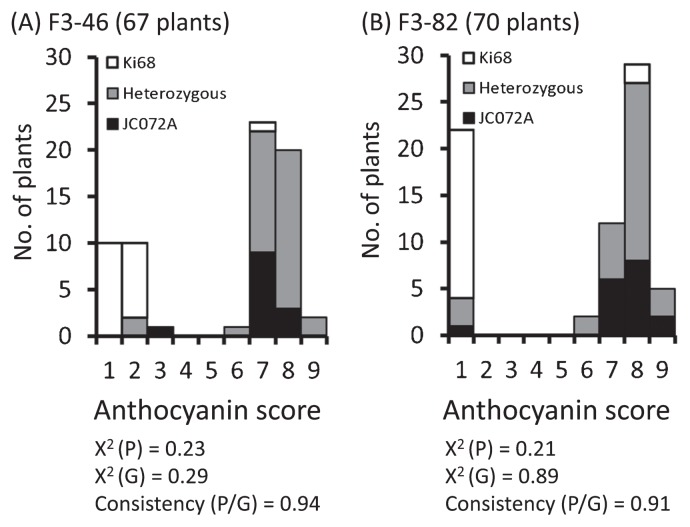
Fig. 1.
Relationship between cob anthocyanin score and Pl1 genotype in two F3 populations. The degree of anthocyanin pigmentation of cobs in F3-46 (67 plants) and F3-82 (70 plants) ranged from 1 (absent or weak) to 9 (very strong). Chi-squared tests assuming a 3:1 ratio were conducted on segregation of the phenotype (x ≤ 3, non-colored; X ≥ 6, colored) and Pl1 genotype (Ki68-type allele, non-colored; JC072A-type and heterozygous, colored). χ2 (P), chi-squared P value of the phenotype; χ2 (G), chi-squared P value of the genotype; consistency (P/G), consistency ratio between phenotype and genotype.

