
Fig. 4.
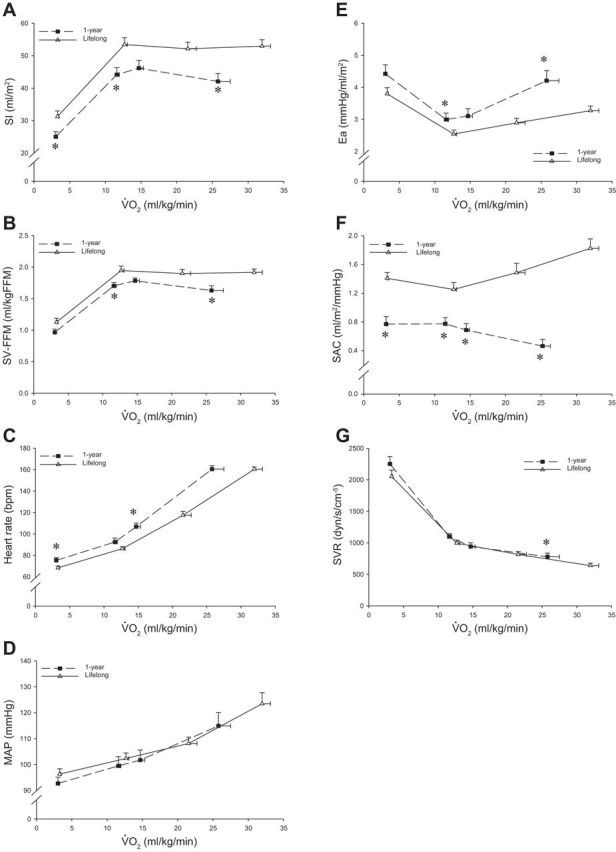
SI (A), SV-FFM (B), heart rate (C), MAP (D), Ea (E), SAC (F), and SVR (G) as a function of scaled V̇o2 after 1 yr of EX + ALG (n = 14) and lifelong exercise (n = 24). bpm, Beats/min. Values are means ± SE. *P < 0.05, committed lifelong exercise vs. after 1 yr of EX + ALG.