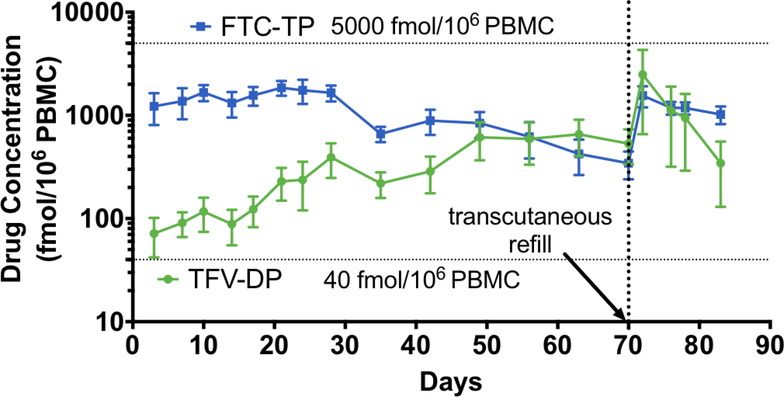
Figure 4. Pharmacokinetic profile of TFV-DP and FTC-TP in PBMCs.
Concentrations of TFV-DP (green) and FTC-TP (blue) in PBMCs from three rhesus macaques at the indicated time points analyzed by LC-MS/MS. Data points represent mean ± SEM. Horizontal dotted line represents preventative target concentration for effective PrEP. Vertical dotted line represents day of transcutaneous refilling of NDI implants (day 70). Animals were euthanized on day 83.

