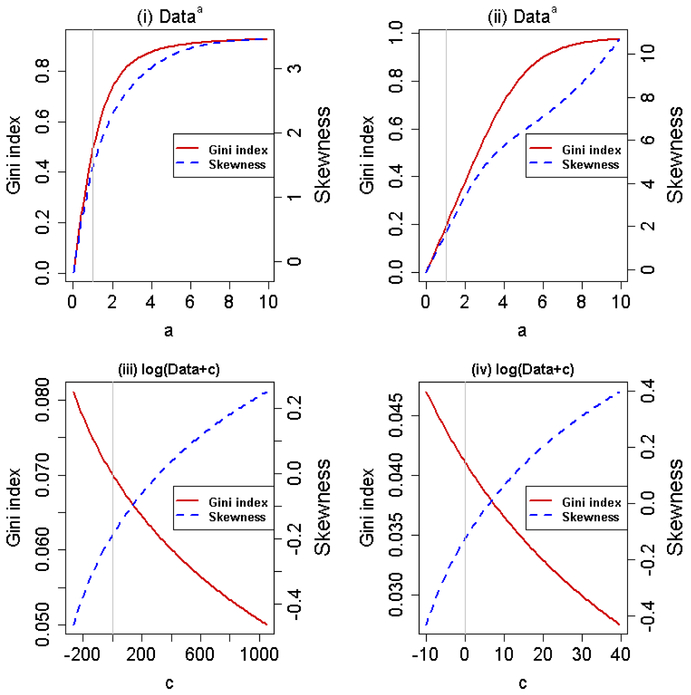
Figure 1.
The relationship between the power transformation (Dataa) and the Gini index estimate/skewness in subfigures (i) and (ii), and between the log transformation (log(Data + c)) and the Gini index estimate/skewness in subfigures (iii) and (iv). The grey vertical lines represent the cases when a = 1 or c = 0. The simulated income data, (531, 786, 1363, 2011, 2321, 2435, 3138, 4310, 5137, 5301, 6382, 8204, 10904, 15901, 21261), are used for subfigures (i) and (iii) and the subfigures (ii) and (iv) are based on the wage data for a group of 3000 male workers in the Mid-Atlantic region available in the R package ISLR called Wage.

