
Figure 5. Deficiency in γδ T cells results in decreased accumulation and functionality of ILC2s and Treg cells.
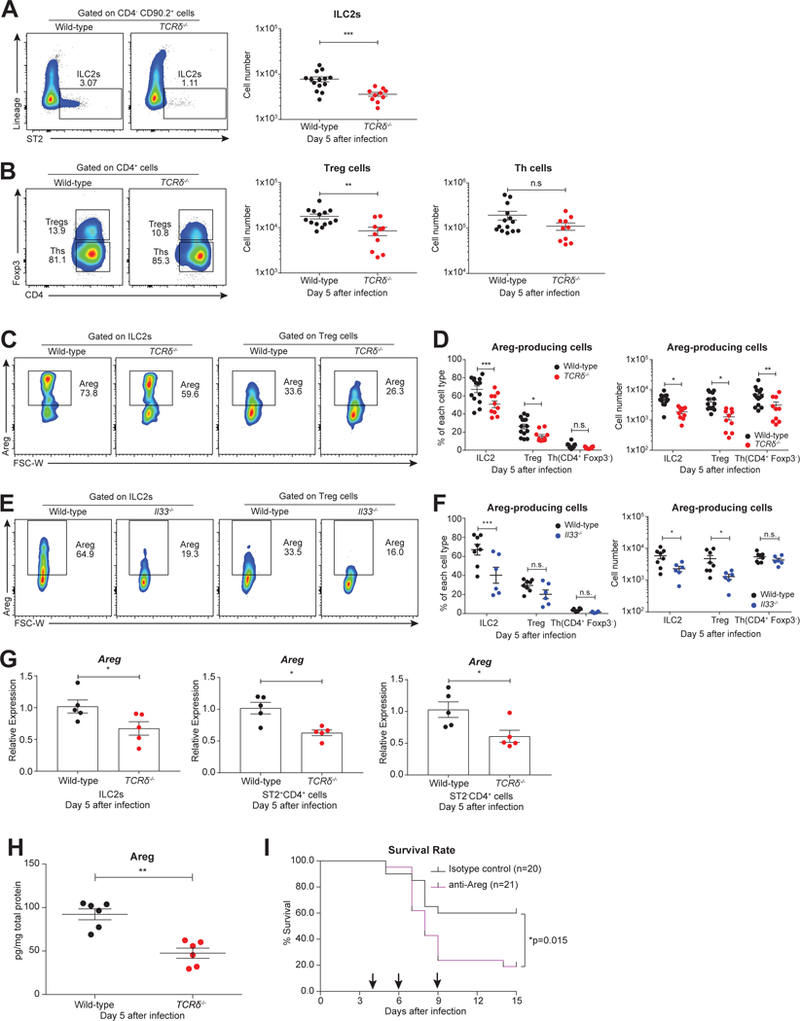
A. Representative flow cytometric plots (left) and cell number (right) of ILC2s (CD4- CD90.2+ Lin- ST2+) in the lungs of infected wild-type (black, n=14) and TCRδ−/− (red, n=10) neonates at day 5 following infection.B. Representative flow cytometric plots (left) and cell number (right) of Treg cells (CD4+ Foxp3+) and Th cells (CD4+ Foxp3-) in the lungs of infected wild-type (black, n=14) and TCRδ−/− (red, n=10) neonates at day 5 following infection.C. Representative flow cytometric plots of Areg-producing cells gated on ILC2s and Treg cells in the lungs of infected wild-type (black, n=14) and TCRδ−/− (red, n=10) neonates at 5 days following infection.D. Frequency (left) and cell number (right) of Areg-producing ILC2s, Treg cells, and Th cells in the lungs of infected wild-type (black, n=14) and TCRδ−/− (red, n=10) neonates at 5 days after infection. (A-D) Data are combined from four independent experiments and shown as mean ± SEM.E. Representative flow cytometric plots of Areg-producing cells gated on ILC2s and Treg cells in the lungs of infected wild-type (black, n=8) and Il33−/− (blue, n=6) neonates at 5 days following infection.F. Frequency (left) and cell number (right) of Areg-producing ILC2s, Treg cells, and Th cells in the lungs of infected wild-type (black, n=8) and Il33−/− (blue, n=6) neonates at 5 days after infection. (E-F) Data are combined from three independent experiments and shown as mean ± SEM.G. Relative expression levels of Areg of ILC2 cells, ST2+CD4+ cells, and ST2-CD4+ cells sorted from wild-type (black, n=5) and TCRδ−/− (red, n=5) neonatal lungs at 5 days after infection measured by quantitative real-time PCR. Samples are pooled from two independent experiments, and data are presented as mean ± SEM.H. Protein levels of Areg in whole-lung lysate from infected wild-type (black, n=6) and TCRδ−/− (red, n=6) neonates at 5 days after infection. Data are combined from two independent experiments and shown as mean ± SEM.I. Survival rate of infected wild-type neonates that were injected intraperitoneally at days 4, 6, and 9 (shown by arrows) after influenza virus infection with Areg neutralizing antibody (purple, α-Areg antibody, 2ug/mouse/timepoint, n=21) or isotype control antibody (black, normal goat IgG control, 2ug/mouse/time point, n=20). Data are combined from three separate trials that individually showed the same trend.*p<0.05, **p<0.01, ***p<0.001, n.s., not significant.