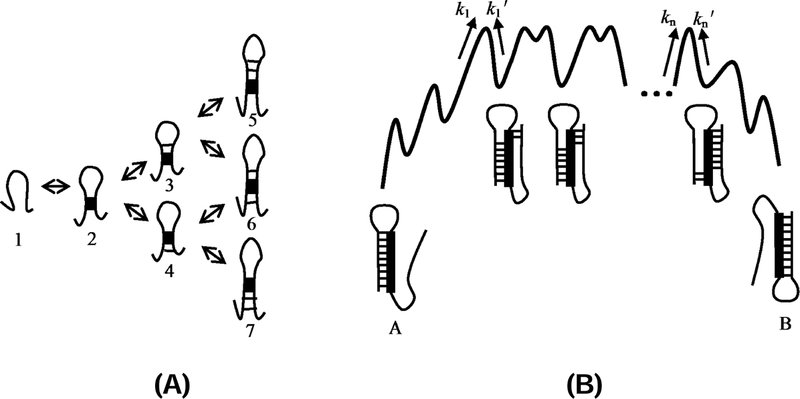
Figure 2:
(A) Multiple pathways for the formation of a helix after the first nucleation stack is formed. For example, after stage 2, there are two folding pathways: 1→2→3 and 1→2→4. (B) The free energy landscape of the tunneling pathway between two overlapping helices A and B. k1 denotes the transition rate of the unfolding of helix A to form the first stack of helix B. denote the transition rates between the neighboring intermediates along the tunneling pathways.22

