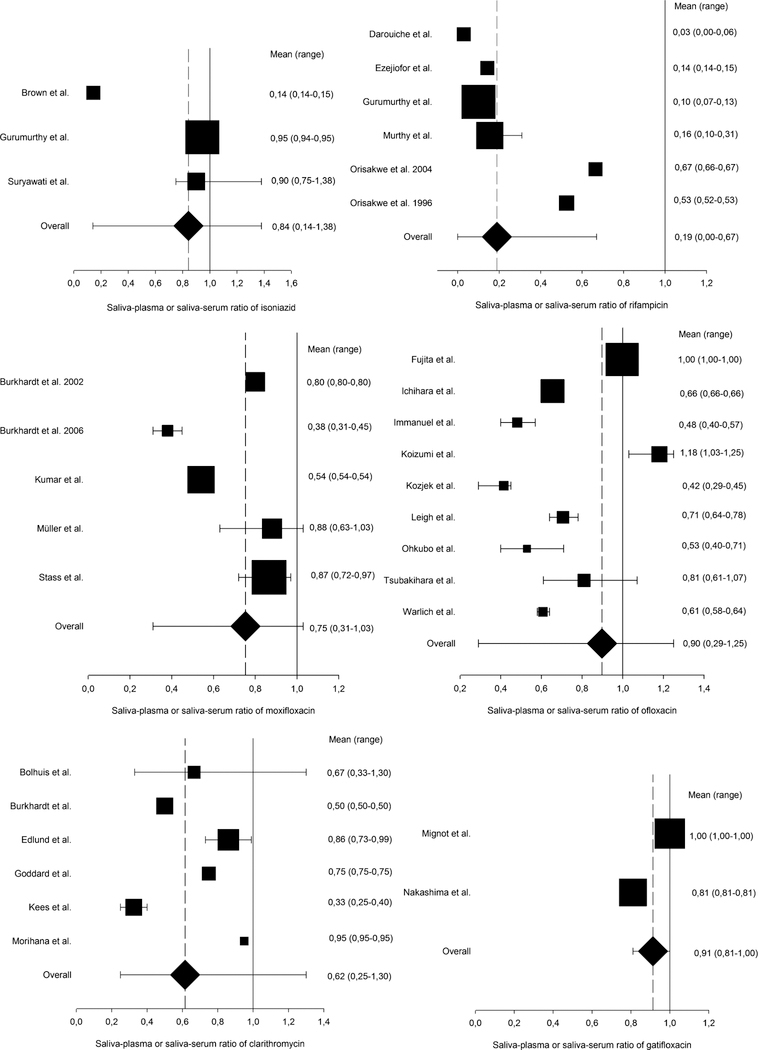
FIGURE 3.
Saliva–plasma or saliva–serum ratios of anti-TB drugs. Top left: isoniazid; top right: rifampicin; middle left: moxifloxacin; middle right: ofloxacin; bottom left: clarithromycin; and bottom right: gatifloxacin. As per drug, the saliva–plasma or saliva–serum ratios of the included articles are displayed as weighted mean () with range. In addition, the overall mean (♦) and range were determined for each drug. All numerical values of mean and range are presented to the right of the graphs.

