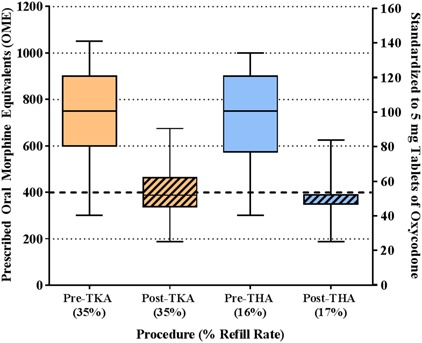
Fig. 1.

This box-and-whisker plot demonstrates the outpatient opioid prescriptions for both TKA and THA in the preguideline and postguideline eras. Orange boxes represent TKA and blue boxes represent THA; solid-colored boxes indicate the preguideline era and hashed colored boxes indicate the postguideline era. The box represents the 25th to 75th percentile IQR and the horizontal line within the box shows the median value. The tails from each box stretch from the 5th to 95th percentile. The left y-axis standardizes the outpatient opioid prescription to OME, whereas the right y-axis standardizes to 5-mg tablets of oxycodone. The dashed horizontal line at 400 OME/50 tablets of 5 mg oxycodone represents the new guideline maximum for primary TKA and THA in opioid-naïve patients. The plot demonstrates a reduction in the discharge opioid prescription for both TKA and THA as well as a much tighter distribution of prescription values in the postguideline era.
