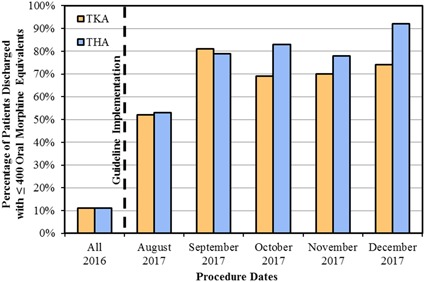
Fig. 2.

This bar graph shows the percentage of patients for whom successful adherence to the new opioid guideline maximum (≤ 400 OME at discharge) was achieved in both patients undergoing TKA (orange) and those undergoing THA (blue). The vertical dashed line indicates separation between the preguideline and postguideline eras. Since implementing the guidelines, there has been improvement from initiation until most recent data collection (p < 0.001).
