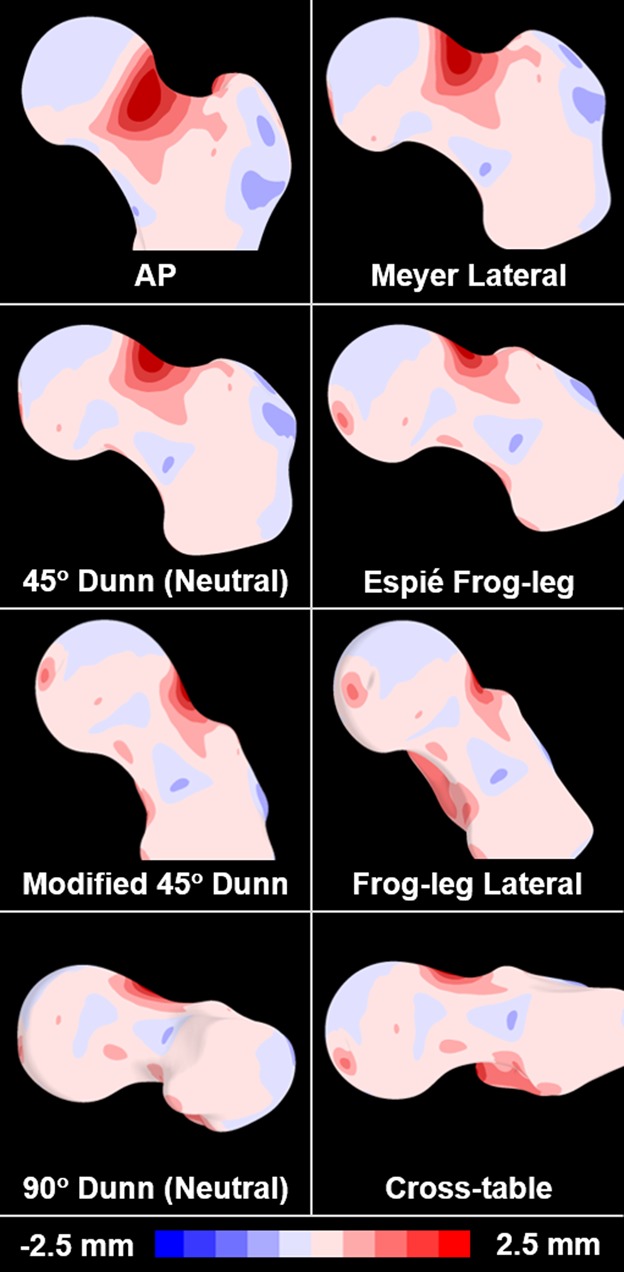
Fig. 3.

The mean cam femur from SSM was aligned to the orientation of the eight digitally reconstructed radiographs to visualize the location and magnitude of the cam lesion relative to the imaging plane. The color map represents the spatial distance between the mean cam and mean control surface reconstructions.
