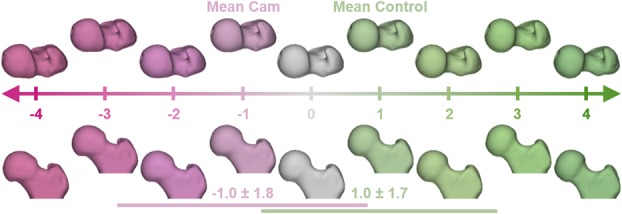
Fig. 5.

Computer-generated femur surface reconstructions representing the spectrum of variability in proximal femoral anatomy as calculated from SSM. The correspondence particles of each femur were mapped onto the spectrum of shape variation to generate a femur-specific shape score. Horizontal lines identify the SD of shape scores for the femur shapes of the patients with cam FAI (magenta) and control group participants (green). Negative shape scores indicate shapes that resemble cam femurs, whereas positive shape scores indicate shapes that resemble control femurs. Along the spectrum, shape variation in the head-neck junction can be seen in both the superior view (top) and the anterior view (bottom), whereas variation of the greater trochanter is best seen in the superior view.
