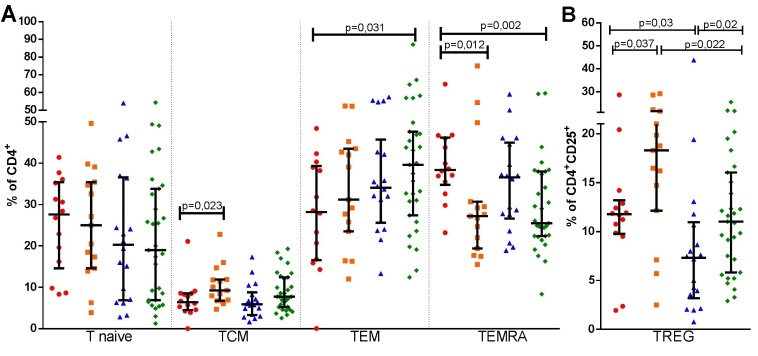
Figure 3.
Aging and end stage renal disease effects in T - cells subsets percentages, T naïve, TCM, TEM, TEMRA (A) and TREG (B). Healthy adults (n=14) (
 ), healthy elderly (n=15) (
 ), end stage renal disease adult patients (n=18) (
 ) and end stage renal disease elderly patients (n=31) (
 ) subsets percentages are shown in the same repeatedly order in each cell subset analysis. TCM - T central memory, TEM - T effector memory, TEMRA - T effector memory with RA reexpression, TREG - regulatory T cells. Bars represent median and interquartile ranges.

