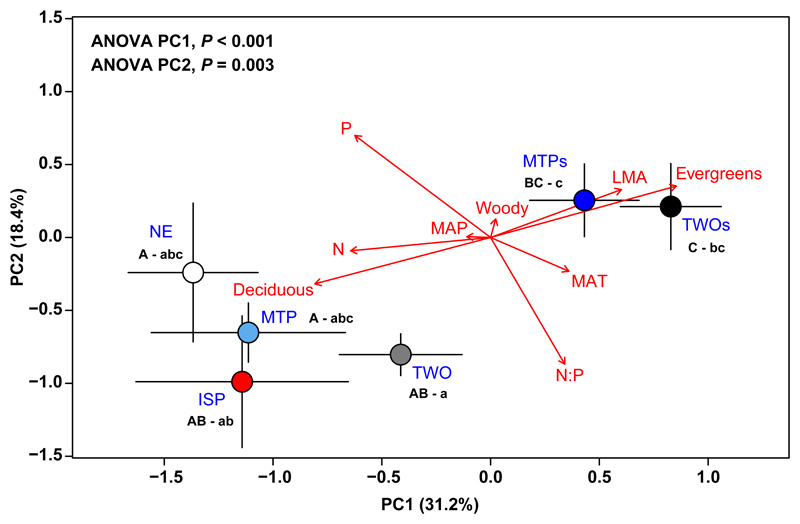
Figure 1.
Average (± standard error) PC1 and PC2 scores per emission type: non-emitters (NE), monoterpene and isoprene emitters only (MTP and ISP, respectively), and emitters of monoterpenes and isoprene (TWO). MTPs and TWOs are the emission types that store monoterpenes. Different upper- and lowercase letters (e.g., AB – ab) indicate statistically significant differences at the 0.05 level amongst emission types for the PC1 and PC2 axes, respectively, following Tukey’s HSD test. Red arrows represent the loadings in the phylogenetic PCA. Factor loadings can be found in Table S3.

