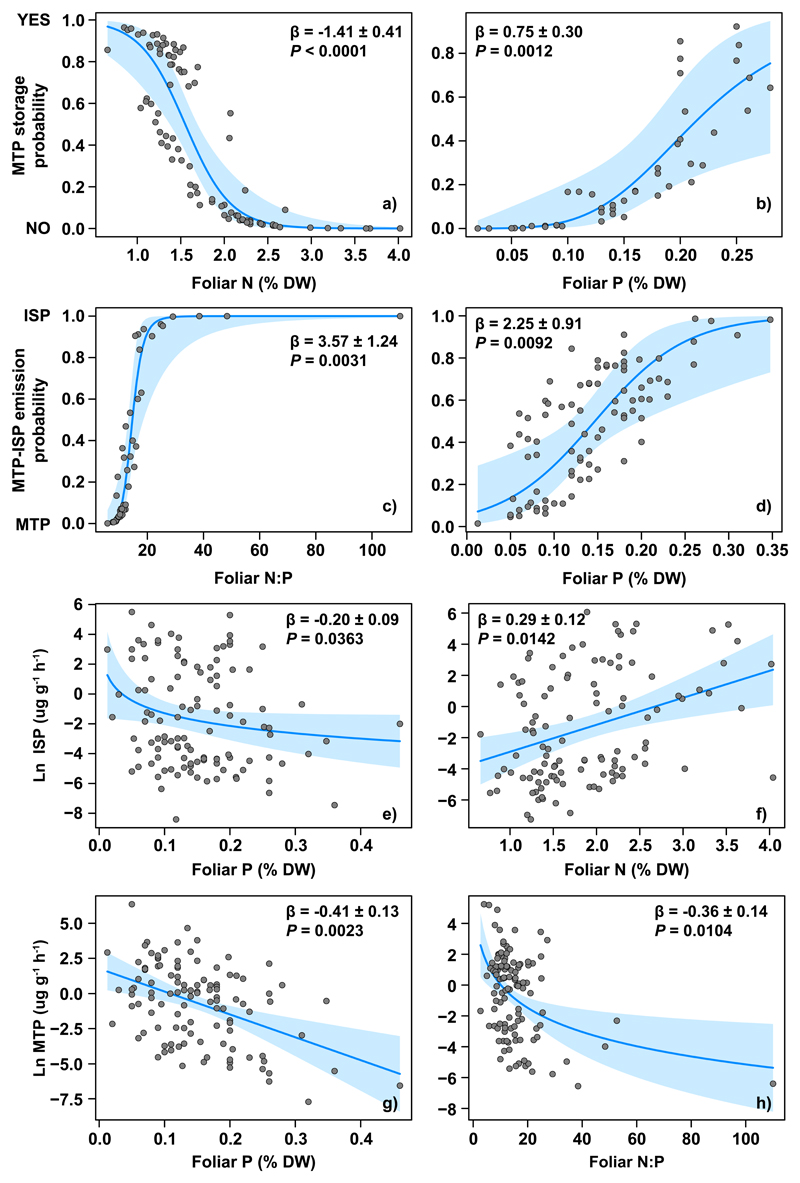
Figure 2.
Partial-residual plots showing the relationships between foliar nutrient concentrations of nitrogen (N) and phosphorus (P) and their stoichiometry (N:P ratio) with the probability that a species stores monoterpenes (1) or not (0) (a, b), or that it emits either monoterpenes (0) or isoprene (1) (c, d), and with emission rates of isoprene (e, f) and monoterpenes (g, h). Results of the models are presented in Table 1. Ln indicates that the variable was log-transformed. Partial-residual plots show variation in the dependent variable in relation to a given predictor (the fitted line), while simultaneously controlling for all other predictors in the model. The blue-shaded area indicated the 95% confidence bands of the slope around the fitted line. Results of the models are presented in Table 1. DW, dry weight.

