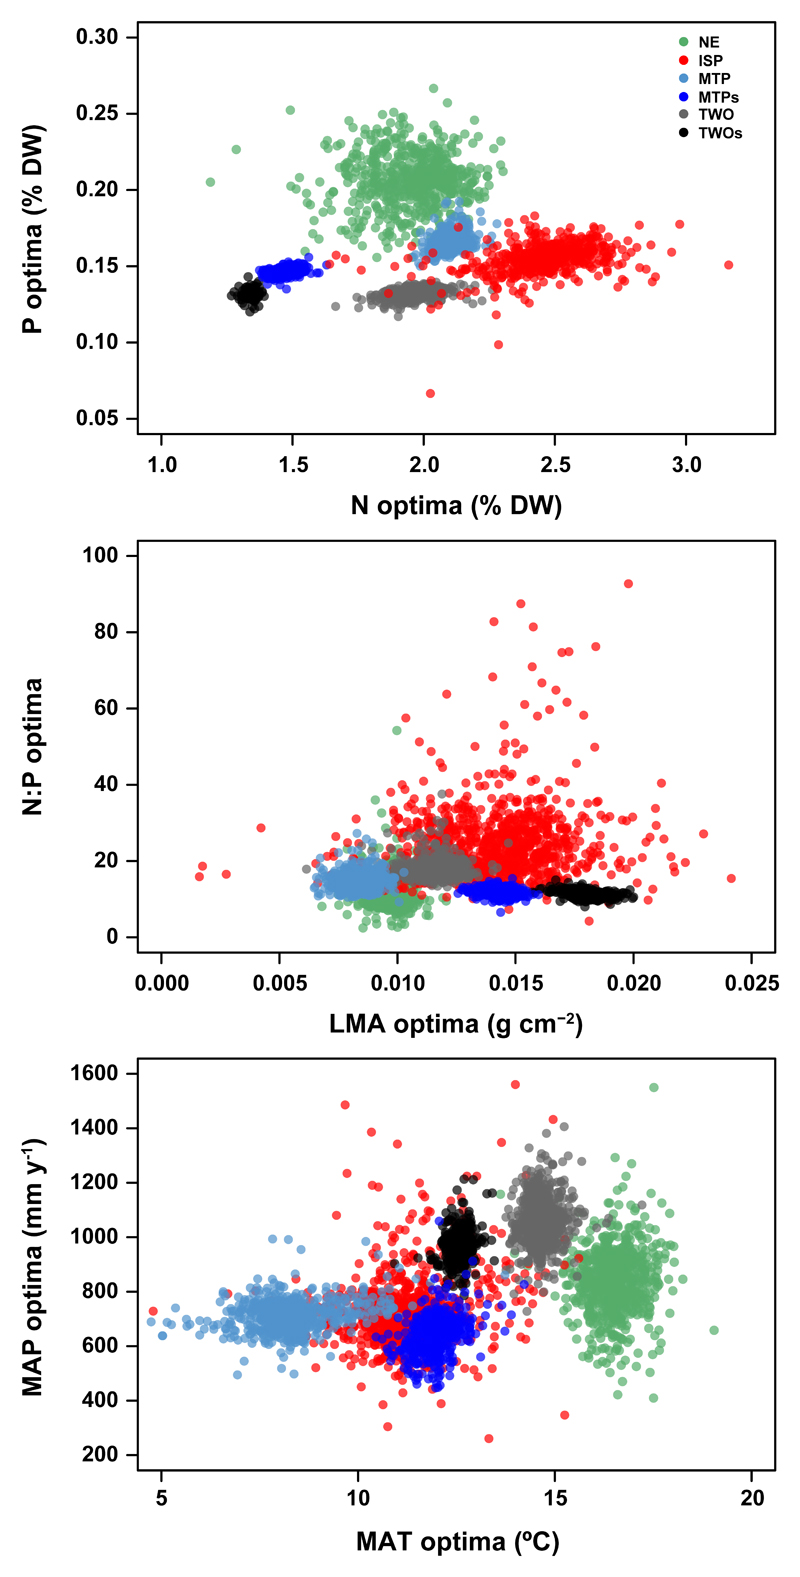
Figure 4.
Optimal values of the predictor variables for the six emission types estimated with OUMV models (Ornstein-Uhlenbeck assuming different optimal values and phenotypic variability for each emission type) for the 1000 stochastic character maps (in the graphs there is a point for every emission type and model). The results for MAT were calculated with OUM models (assuming different state means but equal multiple rates of evolution) due to lower AICc (see Table S4). N, foliar nitrogen concentration; P, foliar phosphorus concentration; LMA, leaf mass per area; MAT, mean annual temperature; MAP, mean annual precipitation; NE, non-emitters; ISP, isoprene emitters only; MTP, monoterpene emitters only; MTPs, monoterpene emitters only that store monoterpenes; TWO, emitters of both isoprene and monoterpenes; TWOs, emitters of both isoprene and monoterpenes that also store monoterpenes; DW, dry weight. Medians are presented in Table 2.

