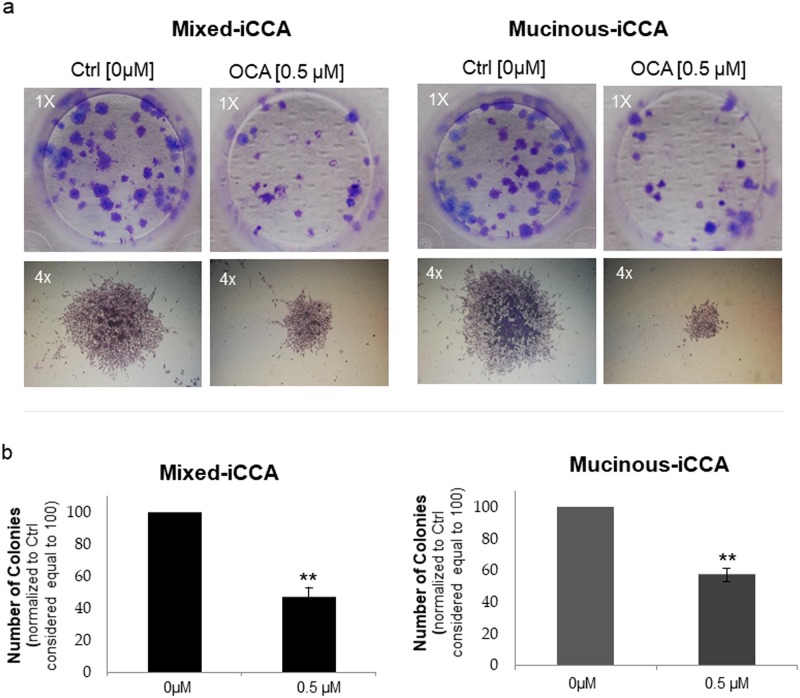
Fig 4. OCA inhibits the colony formation capacity of iCCA cells.
After 10 days of culture, mixed and mucinous iCCA colonies were stained with 0.1% crystal violet and counted (a colony was considered a cluster of at least 50 cells). a) Photographs (magnification 1x) show representative wells in which mixed and mucinous iCCA colonies appear as a violet dot. The number of colonies decreases in the presence of 0.5 μM OCA. Photographs (magnification 4x) show representative colonies formed by mixed and mucinous iCCA cells, with evident decreased dimension induced by 0.5 μM OCA. b) The number of colonies was normalised to control (0 μM OCA) considered equal to 100. The number of colonies formed by both mucinous and mixed iCCA were significantly decreased by 0.5 μM OCA with respect to untreated cells. Data represent means ± SD of N = 5 independent experiments. ** p < 0.01 vs controls without OCA (0 μM OCA).

