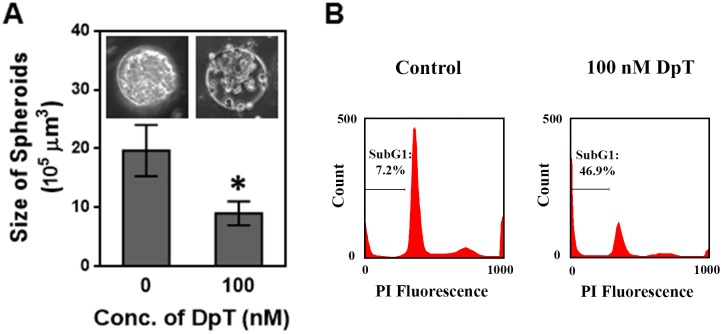
Fig 6. Effect of an anti-tumor agent Dp44mT on U251 spheroids.
A) Bar graph shows the volume of glioma spheroids upon exposure to 0 nM Dp44mT (control) and 100 nM Dp44mT for five days. Data points represent the mean of 10 independent experiments and error bars represent SD. * represents P < 0.01 vs. control (0 nM). The inset shows phase contrast images of the control and Dp44mT-treated spheroids. Sale bar represents 50 μm. B) Flow cytometry data demonstrate the sub-G1 population (i.e. apoptotic cell population) in control and Dp44mT-treated (100 nM) spheroids.

