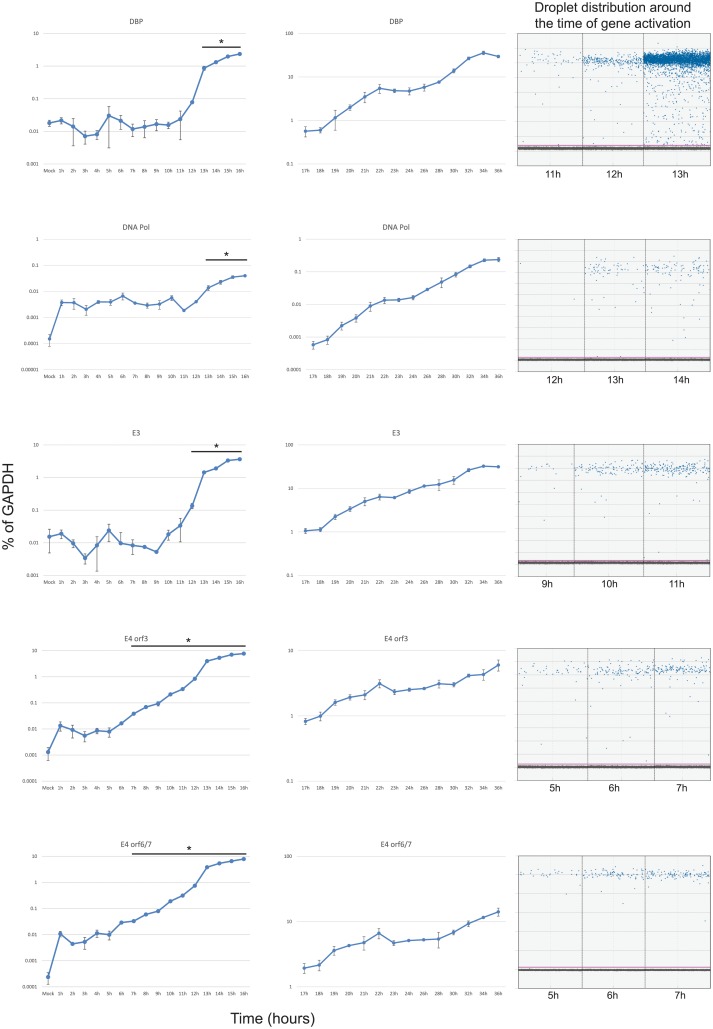
Fig 2. Expression of E2, E3, and E4 during the first 36 hours after infection with HAdV5.
Arrested IMR-90 cells were infected with dl309 at an MOI of 50 and total RNA was extracted at the indicated time points using Nucleozol reagent, treated with DNase I and reverse-transcribed using VILO. Transcript levels of the indicated viral mRNAs were quantified using the BioRad QX200 droplet digital PCR system for the first 16 hours, and using BioRad CFX96 real-time PCR instrument for 17 to 36 hours, and plotted as percentage of GAPDH expression. Right column shows droplet distribution at the time when transcripts increase above background levels. Error bars represent standard deviation of biological replicates, n = 3. Bar with asterisk represents changes above mock level that are statistically significant with the following p values: DBP < 0.001; DNA pol ≤ 0.0058; E3 ≤ 0.0086; E4 orf3 < 0.0001; E4 orf6/7 < 0.0001. All time-points between 17 and 36 hours were statistically significant.

