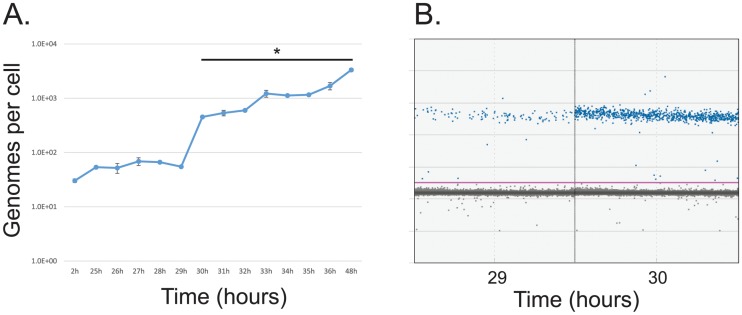
Fig 7. Analysis of viral genome copy number in the first 48 hours of infection with HAdV5.
(A) Arrested IMR-90 cells were infected with dl309 at a MOI of 50. Viral DNA was extracted at the indicated time points, and absolute quantification of viral genomes using E4orf3 primers was measured using the BioRad QX200 droplet digital PCR system. Viral genomes are plotted on per cell basis. Error bars represent standard deviation of biological replicates, n = 2. Bar with asterisk represents changes above mock level that are statistically significant with p ≤ 0.0001. (B) Sample droplet distribution from one of the biological replicates for 29 and 30 hour time points from (A).

