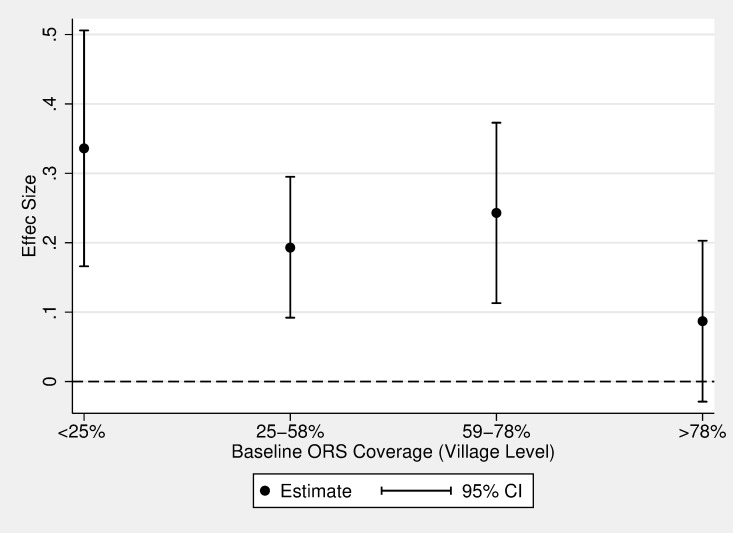
Fig 3. Endline ORS use by baseline village-level ORS use.
This figure presents the effect size of the free + convenient intervention relative to the control group at different levels of baseline ORS coverage. The x-axis represents the cut points of the quartiles of baseline village-level ORS coverage; quartile 1 = 11%–24%; quartile 2 = 25%–58%; quartile 3 = 59%–78%; and quartile 4 = 79%–100%. The y-axis represents endline ORS coverage. This figure demonstrates that the intervention had a stronger effect among villages with particularly low ORS use at baseline. Interaction models show that the treatment effect is statistically different between <25% and >78% (interaction term = 0.249; P = 0.018) and between 59%–78% and >78% (interaction term = 0.156; P = 0.079). ORS, oral rehydration salts.

