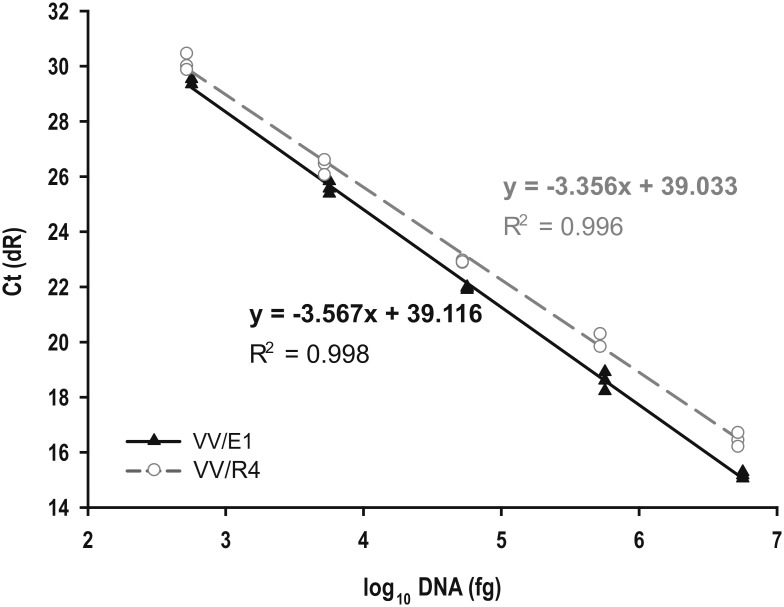
Fig 4. qPCR standard curves.
Representative amplification curves obtained by plotting the mean Ct values with respect to the logarithm of genomic DNA quantity from Streptomyces sp. VV/E1 (black line) and Streptomyces sp. VV/R4 (grey line). Standard curves were generated with 10-fold serial dilutions of genomic DNA concentrations from 5.65 x 10⁶ fg to 56.5 fg (VV/E1 strain) or 5.2 x 10⁶ fg to 52.0 fg (VV/R4 strain) by SYBR green qPCR reactions.

