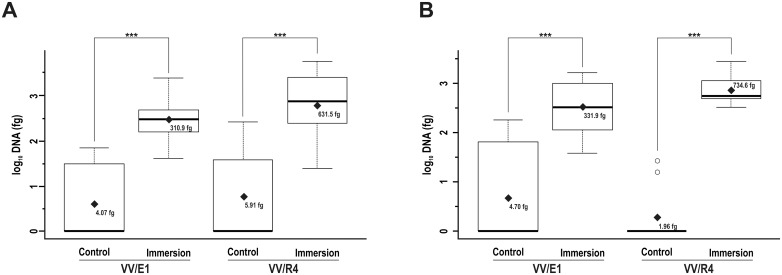
Fig 5. Quantification in RI and RS DNA samples from the Streptomyces sp. strains inoculated by immersion.
Box plot showing the DNA levels from Streptomyces sp. VV/E1 and Streptomyces sp. VV/R4 strains in plants subjected to inoculation by immersion as compared to control plants in the (A) RI, and (B) RS areas. Black rhombuses show the average values (back transformed) for each treatment. Asterisks indicate existence of significant differences according the LSD-test performed: * p < 0.05; ** p < 0.01; *** p < 0.001. Circles correspond to data outliers (falling outside the Q1-Q3 range).

