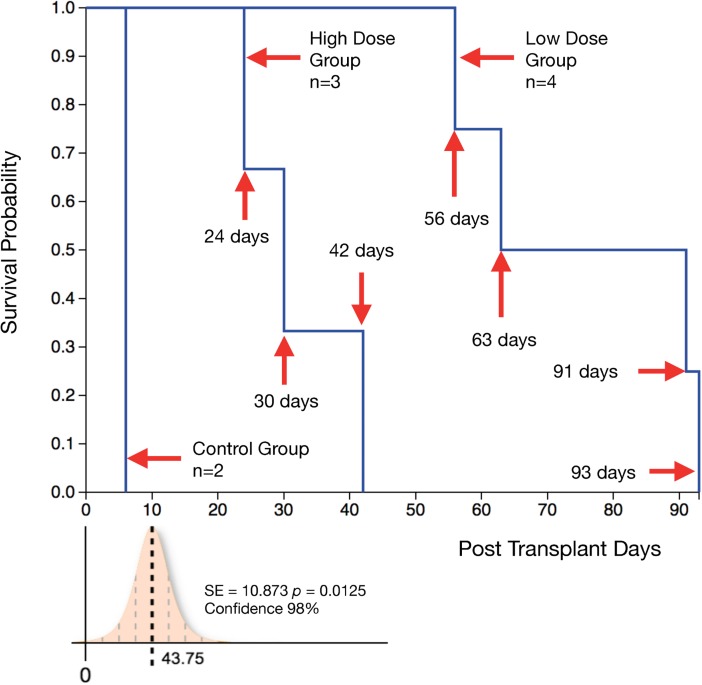
Fig 2. Kaplan-Meier survival plot of time to reaching Grade III rejection in transplanted limb.
The hazard rate for AR differs between the high dose and low dose group (log-rank test; z = 2.57, p = 0.0101, Confidence—98%). There is a survival difference between high dose group (death censored) and low dose group (p = 0.0125) (high dose animals required to be euthanized with non- rejecting grafts due to failure to thrive).

