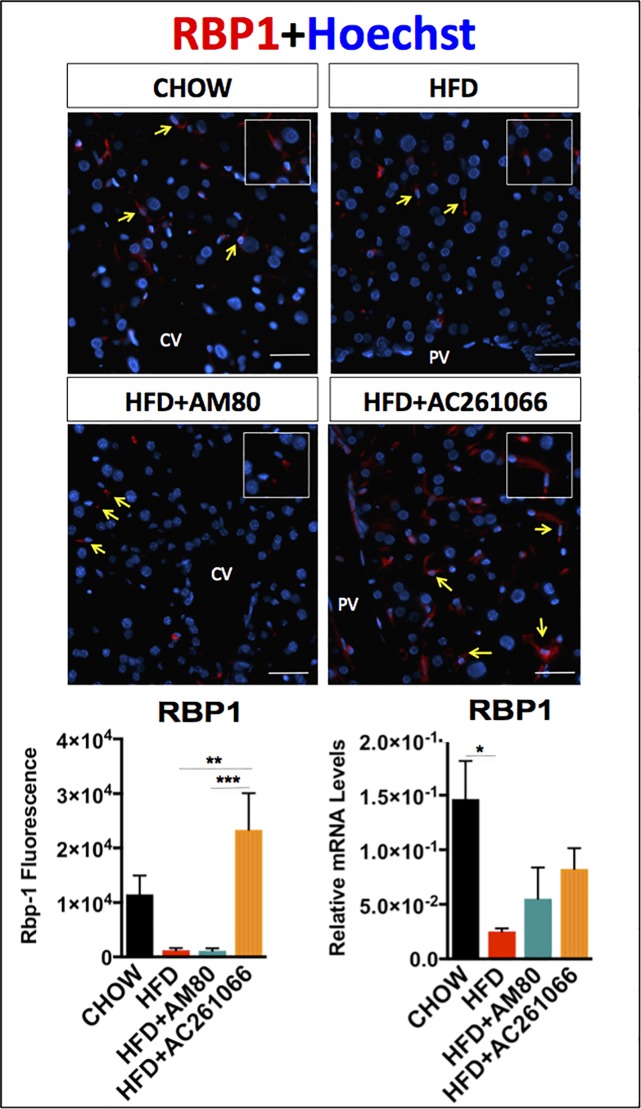
Fig 3. The RARβ2 agonist AC261066 increases the hepatic levels of RBP1 in HFD-fed mice.
Representative images depicting RBP1 in red and nuclei in blue (Hoechst labeling) assessed by immunofluorescence in frozen liver tissues and by qRT-PCR in chow-, HFD-, HFD+AM80-, and HFD+AC261066-treated mice. Yellow arrows in the images indicate representative areas of RBP1-positivity (inserts). Quantification of the immunofluorescence and mRNA levels is represented as a bar plot. The plots are represented as mean ± standard deviation (SD) (mice per group = 3–4; image fields per mouse > 4). Statistical significance is assessed by one-way ANOVA (black stars), p < 0.05 = *; p < 0.01 = **; p < 0.001 = ***. Magnification = 200X. Scale bar = 100 μm. CV = central vein; PV = portal vein.

