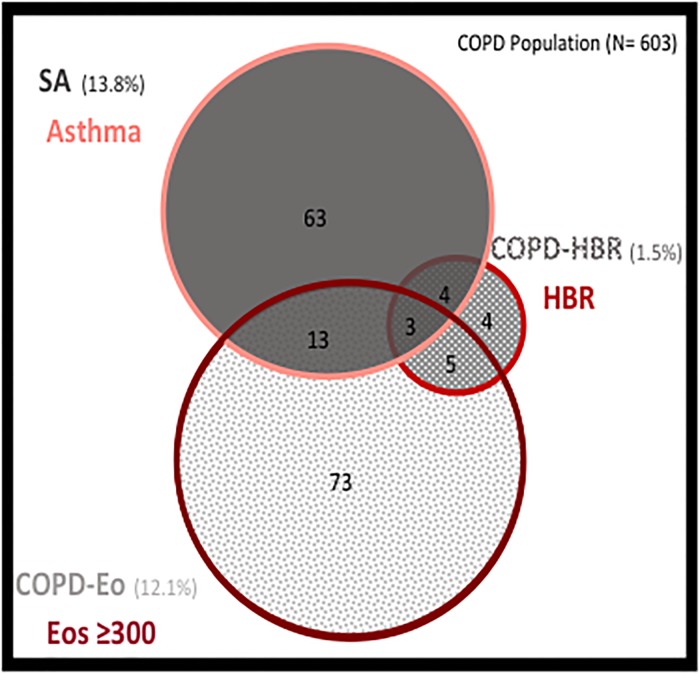
Fig 3. Venn diagram representing the overlap of the three ACO phenotypes.
The square represents the entire COPD population. Patients who meet more than one definition of ACO are those who overlap with more than one circumference. COPD: Chronic obstructive pulmonary disease; Eos: Eosinophil; ACO: Asthma-COPD overlap; HBR: High bronchodilator response.

