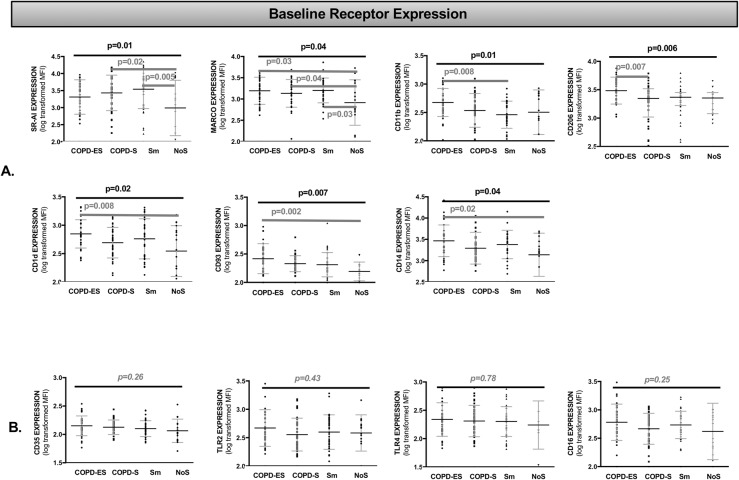
Fig 1. Cell surface bacterial recognition receptor expression at baseline was greater on MDMs from subjects with COPD and healthy smokers as compared to non-smokers.
Analysis by one-way ANOVA for receptor MFI (mean fluorescence intensity), representative of cell surface receptor density, presented as an aligned dot-plot with thin black bar at the mean, flanking short grey bars delineating the SD. Thick black horizontal bars above the entire graph mark the ANOVA results of statistical significance. Thick dark grey horizontal bars start and end at the comparisons of statistical significance identified in multiple comparison analysis (A). The bottom row (B) presents the receptors that did not have significant differences in cell surface expression between groups at baseline. Holm-Sidak correction was performed for multiple comparisons. COPD-ES = COPD ex-smoker, COPD-S = COPD current smoker, Sm = smoker without COPD, NoS = non-smoker healthy control, SR-AI = Scavenger receptor A-I, MARCO = Macrophage receptor with collagenous structure, TLR = Toll like receptor. S2 Fig demonstrates the Fig 1A differences in baseline receptor expression in heat map format.

