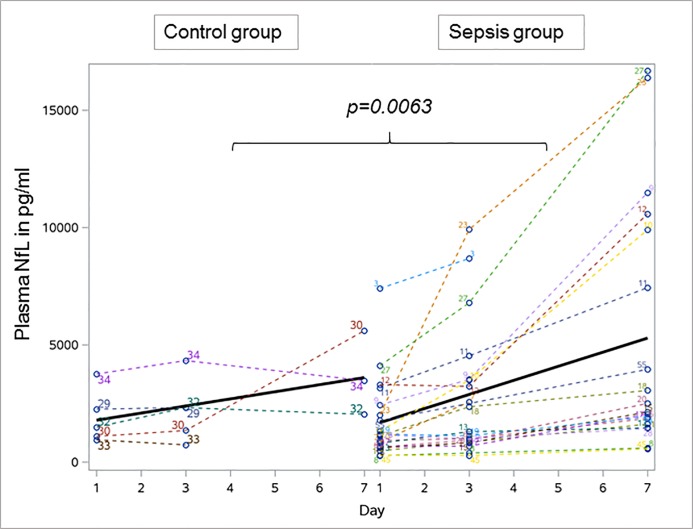
Fig 2. Longitudinal profile of neurofilament light chains over time in 20 sepsis and five control patients.
The NfL levels significantly increased in sepsis patients over time and remained stable in controls. Bold line indicates the development of mean plasma neurofilament levels over time. NfL Neurofilament light chains.

