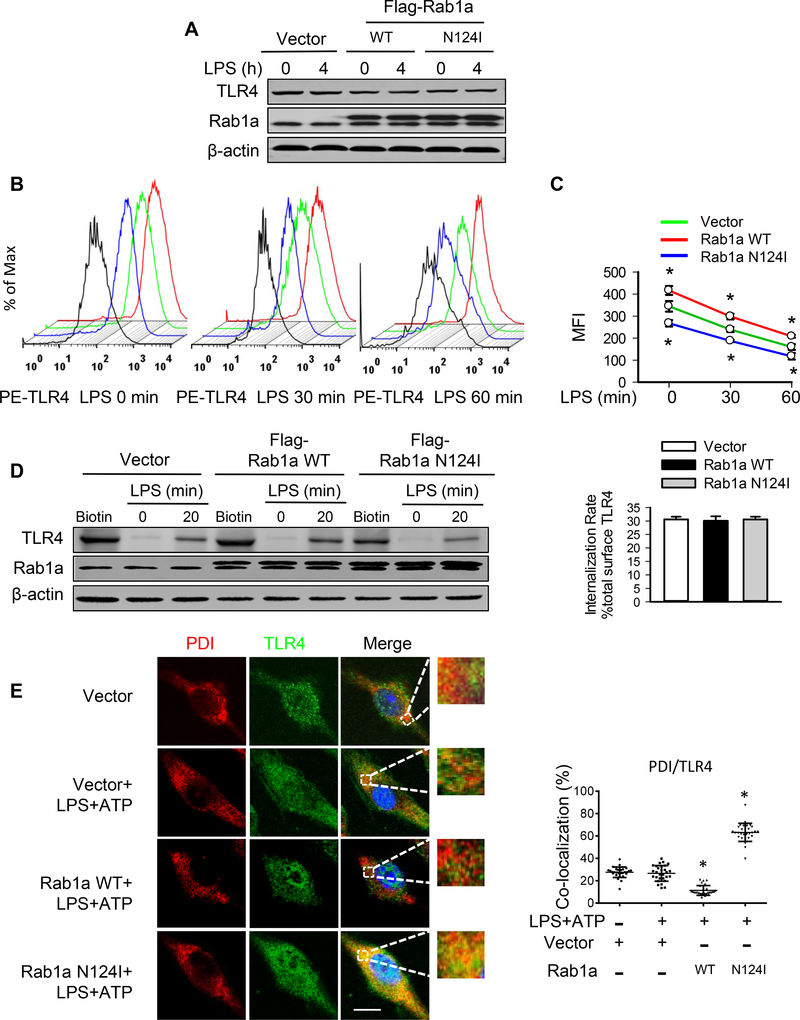
Figure 4. Rab1a induces cell surface expression of TLR4 via enhancement of TLR trafficking to plasmalemma.
BMDMs were transfected with empty vector, Flag-tagged Rab1a WT, or Rab1a N124I cDNA. At 48 h posttransfection, the macrophages were incubated with LPS (20 ng/ml) for the indicated time (A-D). (A) Effects of expression of Rab1a WT or Rab1a N124I on TLR4 protein expression. (B) Representative histograms of flow cytometry experiments demonstrating the effects of different Rab1a expression on cell surface expression of TLR4 protein in response to LPS stimulation. Cell surface expression of TLR4 protein was evaluated using phycoerythrin (PE)-conjugated MTS510 Ab and fluorescence-activated cell sorting analysis. Black lines depict staining with irrelevant IgG2a. (C) Quantitative data showing changes in mean fluorescent intensity (MFI) of PE-TLR4 following LPS stimulation (n = 3). (D) Effects of different Rab1a expression on TLR4 internalization. Left panel, cell surface biotinylation of TLR4 in BMDMs; right panel, the internalization rate. (E) Accumulation of TLR4 in ER compartment of macrophages. Transfected macrophages were primed with LPS (20 ng/ ml) for 4 h and stimulated with ATP (5 mM) for 30 min. Subcellular distribution of TLR4 was detected by immunofluorescence for PDI (red) and TLR4 (green). Left panel, representative confocal images showing colocalization of PDI and TLR4. Bars, 10 μm. Right panel, quantification of TLR4/PDI colocalization. Results are representative of 3 independent experiments. *p<0.05 vs. vector control (LPS+ATP), Student t test.

