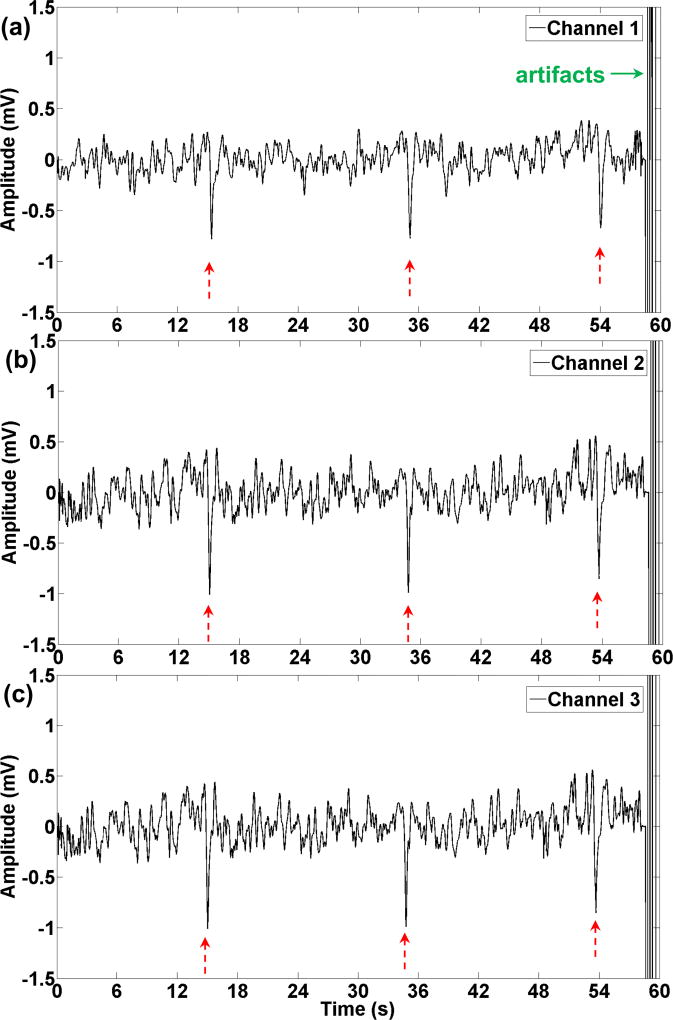
Fig. 9.
One minute of slow waves recorded with the wireless device. (a)–(c) corresponds to channels 1–3. Three peaks (shown with red arrows) can be distinguished in this segment that matches with the regular frequency of the stomach (3cpm). Electrical stimulation was delivered to the stomach that caused the artifacts (green arrow) at the end of the one minute signal.

