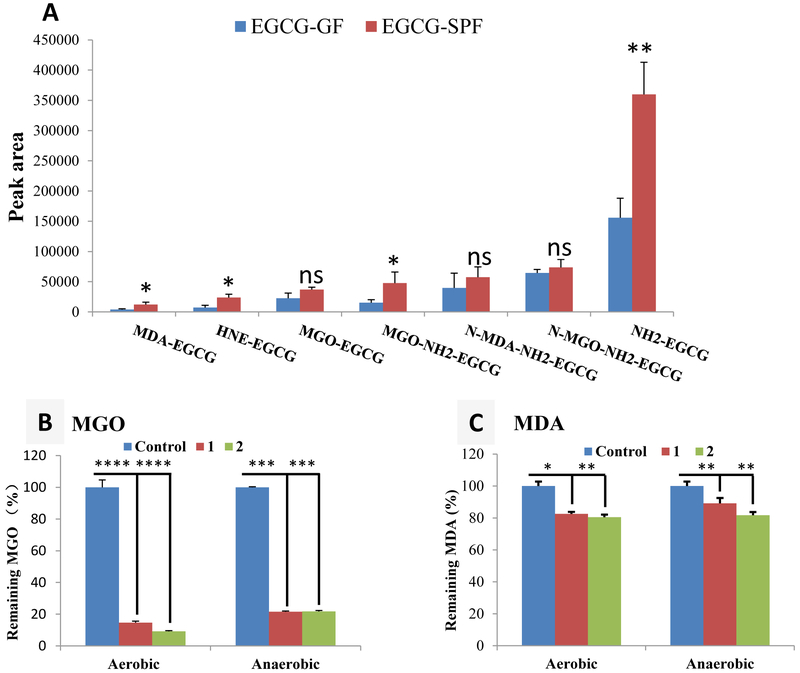
Figure 6.
The impacts of gut microbiota and oxygen on the scavenging capacity of EGCG. (A) the average of peak areas of the metabolites of EGCG (4'-NH2-EGCG, MGO-EGCG, MGO-NH2-EGCG, N-MGO-NEE-EGCG. MDA-EGCG, N-MDA-NH2-EGCG. and HNE-EGCG) from fecal samples collected from EGCG treated GF and SPF mice. Data are presented as the means ± standard deviation of three replications. A 2-tailed Student’s t test distribution with paired groups was evaluated for statistical significance. p > 0.05 was considered not significant (ns), and * p < 0.05 and ** p < 0.005 were considered statistically significant. (B, C) Trapping of MGO (200 μM) and MDA (200 μM) by EGCG (600 μM) and 4'-NH2-EGCG (600 μM) in phosphate buffer (pH 7.4 and 37 °C) at 6 h (MGO) and 12 h (MDA). Data are presented as the means ± standard deviation of three replications. A 2-tailed Student’s t test distribution with paired groups was evaluated for statistical significance. * p < 0.05, ** p < 0.005, *** p < 0.001, and **** p < 0.0001.

