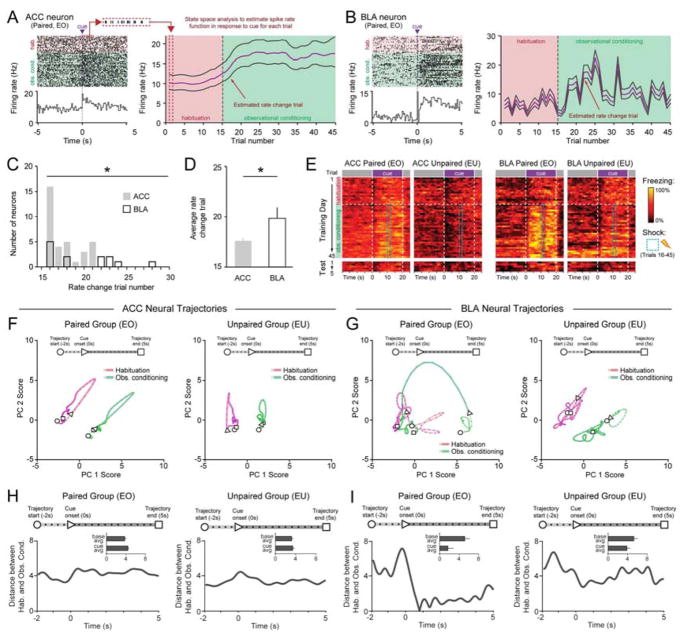
Figure 3. ACC and BLA contain neural correlates of observational learning.
A–B. Raster and PSTH (100ms bins) of an ACC (A) and BLA (B) neuron identified as having a significant change in cue response during conditioning. State-space analysis provides a probabilistic estimate of the trial at which the neuron undergoes a rate change.
C. The distribution of rate change trials calculated by state-space analysis of conditioning-dependent neurons was significantly earlier in ACC than BLA neurons (Kolmogorov-Smirnov test, *P <0.05).
D. The average rate change trial of neurons in the ACC was earlier than those in the BLA (two-tailed, unpaired student’s t-test, t=2.622, df=45, *P=0.0119).
E. Behavioral rasters (1s bins) of average freezing for all paired (EO) and unpaired (EU) mice across Day 1:Training and Day 2:Test in both ACC and BLA groups.
F–G. Neural ensemble dynamics in ACC and BLA across habituation and conditioning trials. Trial-averaged neural trajectories projected on a 2D space formed by first (PC1) and second (PC2) principle components for ACC neurons (F) (paired, n=201 neurons, N=12 mice; unpaired n=93 neurons, N=7 mice) and BLA neurons (paired, n=106, N=6 mice; unpaired n=97 neurons, N=6 mice). Dots on the trajectories represent timestamps (50 ms).
H–I. Calculated Euclidean distance between trajectory for habituation and trajectory for observational conditioning in paired and unpaired mice in the ACC (H) and BLA (I) plotted as distance across time (−2s to +5s from CS onset). Insets show averaged values for baseline and cue period. The distance between baseline and cue epochs in the BLA paired group was significantly different from other groups (Pearson’s chi-square test: χ2=4.953, *P=0.026).

