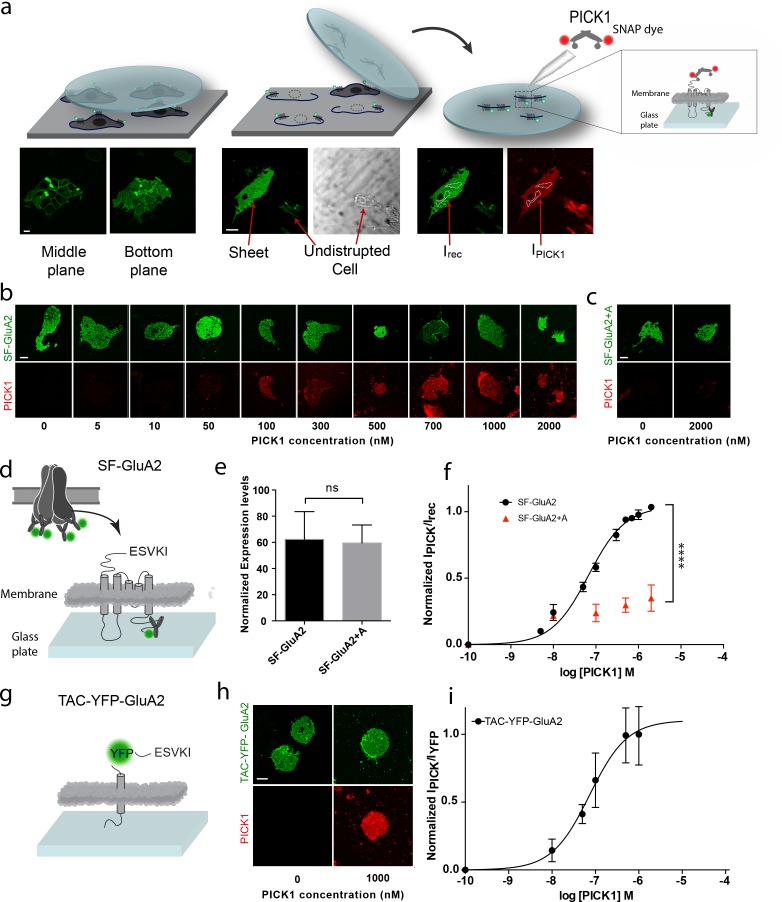
Figure 1. PICK1 PDZ binds with nanomolar binding strength to transmembrane interaction partners in semi-native membranes.
(a) SCMS were prepared from HEK293 Grip tite cells transfected with a fluorescently labeled (green) membrane protein of interest (left) by pressing a pre-coated glass coverslip onto the cells (middle) and subsequently detaching the apical plasma membranes from the remains of the cells (right). Single bilayers were readily distinguished from undisrupted cells or organelles by their lack of three-dimensional structure. SCMS were incubated with buffer containing fluorescently labeled scaffolding protein (red). Binding was quantified by measuring the intensity of PICK1, IPICK1, relative to the intensity of the receptor, Irec, in a region of interest (dashed white lines). (b) Representative confocal images demonstrating concentration dependent binding of PICK1 (red) to SCMS expressing SF-GluA2 (green), or (c) endpoints for SF-GluA2 +A. (d) Schematic representation of SF-GluA2 constructs labeled with anti-FLAG M1-alexa 488 antibody. (e) Expression levels of SF-GluA2 and SF-GluA2 +A in SCMS were similar (p=0.66). (f) Quantification of concentration dependent binding of PICK1 on SCMS’s expressing SF-GluA2 (black) (Kd*=67 ± 6 nM), or SF-GluA2 +A (red), (n = 3, ****p≤0.0001). (g) Schematic representation of TAC-YFP-GluA2 constructs (h) Representative end points of PICK1 concentrations series. (i) Quantification of concentration dependent binding of PICK1 to TAC-YFP-GluA2 (Kd*=73 ± 19 nM) (n = 3). Scale bars 10 μm.

