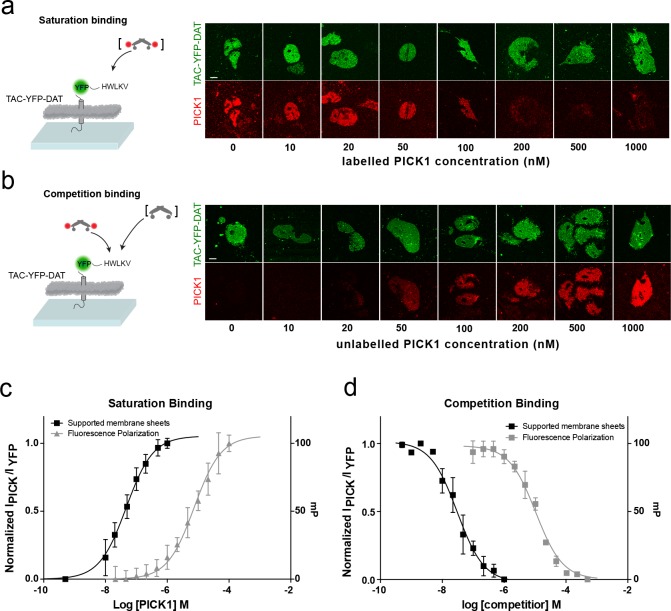
Figure 2. PICK1 binding on SCMS is specific and the binding strength is increased two orders of magnitude compared to in-solution affinities.
Schematic and representative confocal images demonstrating saturation with labeled PICK1 (a) and competition between labeled PICK1 and unlabeled PICK1 (b) on SCMS expressing TAC-YFP-DAT. Brackets indicate the varied PICK1 pool. (c) Normalized binding as a function of unlabeled PICK1 concentration (black), left axis (Kd*=47 ± 5 nM) (n = 7) compared to in-solution based FP-measurements (grey), right axis (Kd = 9± 2 μM, n = 3, performed in triplicates). (d) Normalized binding as a function of unlabeled PICK1 concentration (black), left axis (IC50 = 29 ± 4 nM) (n = 5) compared to in-solution based FP-measurements (grey), right axis (Ki,app = 2 ± 0.4 μM, n = 3, performed in triplicates). Scale bars 10 μm.


